June 10, 2025

We're excited to share the latest enhancements to Fathom’s Insights Dashboard, continuing our commitment to delivering greater value, usability, and actionable insights. It’s been great to hear how you’ve been using the Insights Dashboard since its launch in March. We think you’ll love these newest features which offer you more customization, even deeper analysis and improved visibility across your entire portfolio.
You can now download your dashboard results directly to Excel, making it easier to share insights, conduct further analysis, or present findings in your preferred format.

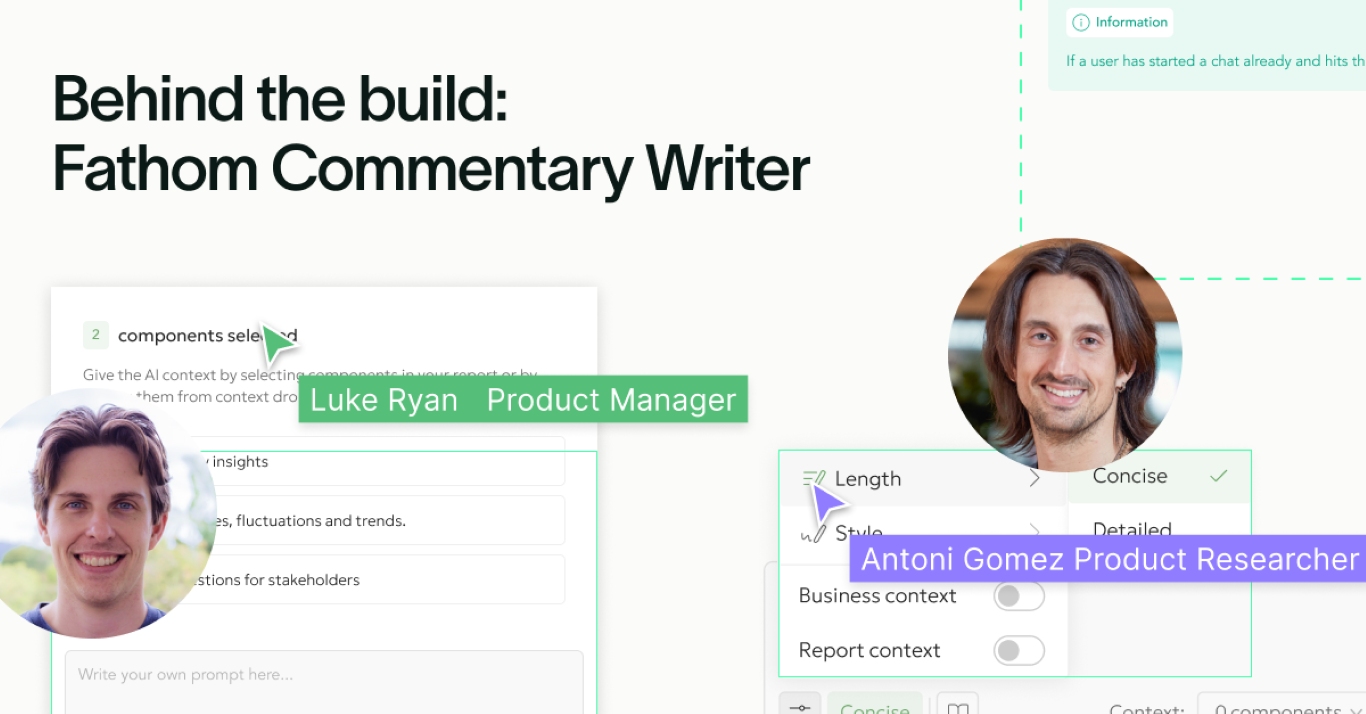
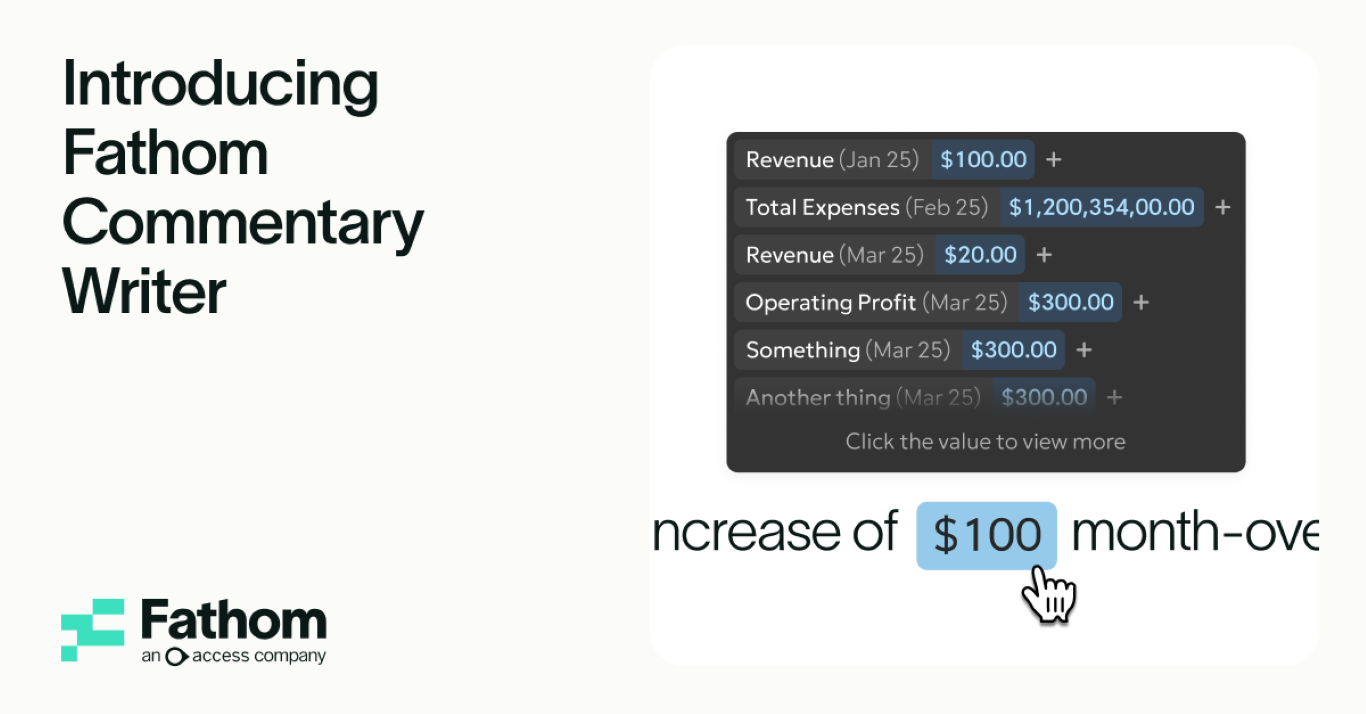
You can now add customised commentary to each page of a summary report generated from the Insights Dashboard. This new feature allows you to contextualise results, highlight trends, and communicate key takeaways more effectively with your clients. So your reports are not only more insightful, but also more engaging.

When viewing the Profit & Loss and Balance Sheet within a Summary Report, you’ll now see the results of the prior period alongside the current period results, as well as the variance between the two. This enhancement makes it easier to compare, and gives better insight into financial performance over time.
We’ve introduced 10 new metrics to the Insights Dashboard. These additions give you a more comprehensive view of financial and operational performance across companies. The new metrics include:
These metrics provide richer insights for evaluating performance, identifying risks, and uncovering opportunities across your portfolio.
You can now compare a selected metric’s growth or performance against the same period last year on the Insights Dashboard. This feature supports better trend analysis and year-on-year performance tracking, helping you detect seasonal patterns and support strategic planning.

We’ve enhanced the thresholds feature by allowing you to define them by Month, Quarter, or Year. Fathom will automatically aggregate or disaggregate thresholds depending on the period you’re viewing, ensuring consistency and flexibility in performance monitoring – no matter how you slice the data.

These updates give you deeper insights and more customisable reporting, which is great news if you want to see better engagement and more confident decisions across your client base.

Luke is a Product Manager at Fathom. He values customer relationships and insights as a driving factor behind product strategy and roadmaps. Luke has a background in both Technology and Finance, having worked as a Product Manager and Financial Analyst. Luke holds Bachelor’s in Business and IT, a Masters in Applied Finance, and can talk endlessly about craft beer and homebrew.
Connects to your favourite accounting tools. No set up fee. No credit card required.
Try free for 14 days →Trusted by 100,000+ businesses worldwide
Get a clearer picture of your business performance and in-depth analysis of your numbers.
See all features
Live data from your favourite accounting tools in Fathom. No exports, no manual uploads, ever.
See all integrations
Trusted by 100,000+ businesses worldwide
Fathom connects your accounting tool automatically and handles the heavy lifting — so you can focus on what the numbers actually mean.
Try free for 14 days →No setup fee

No credit card
AI Commentary