May 11, 2026

"Are we on track against plan?" sounds simple. It's not. The number on the page, +4% or -8%, rarely tells the whole story. And when you hand a board a variance table without context, you create more questions than you answer.
In Fathom's State of Financial Storytelling 2026 survey, budget vs actual tracking was cited by 1 in 5 finance leaders as a top board question. Look at how they phrase it:
"Are variances timing or structural?" (Finance Director, Technology, UK)
"What are the key drivers behind variances this quarter?" (CFO, Professional Services, US)
"Reforecast the annual budget taking into account YTD results." (Controller, Manufacturing, US)
"More detail on material variances vs budget." (CFO, Technology, AU)
Your board doesn't want to know that revenue is 8% below plan. They want to know why, whether it matters, and what the updated outlook is. Answering "Are we on track?" well means telling a three-part story: what happened, why, and what it means for the rest of the year.
Most finance leaders open their board presentation with a variance table. Revenue: -8%. COGS: +3%. EBITDA: -12%. The board immediately fixates on the biggest negative number and starts asking questions you'd planned to address three slides later.
Flip the order. Start with a short commentary that frames the picture before anyone sees the detail:
"Revenue is tracking 8% below plan for Q3. Two enterprise deals ($340K combined) slipped from March to April based on updated close dates. Operating expenses are in line with budget. If both deals close as expected, full-year revenue will land within 2% of the annual plan. The reforecast reflects this updated timeline."
Now the board has context. When they look at the numbers, they're reading with understanding rather than reacting with alarm. The variance table becomes supporting evidence, not the headline.
This is the distinction boards care most about, and the one most variance reports fail to make.
A timing variance means the money's still coming. A deal slipped. An invoice went out late. Revenue is real but the timing moved. The annual picture isn't affected.
A structural variance means something has changed. A customer churned. A product line is underperforming. Pricing is under pressure. The annual picture needs updating.
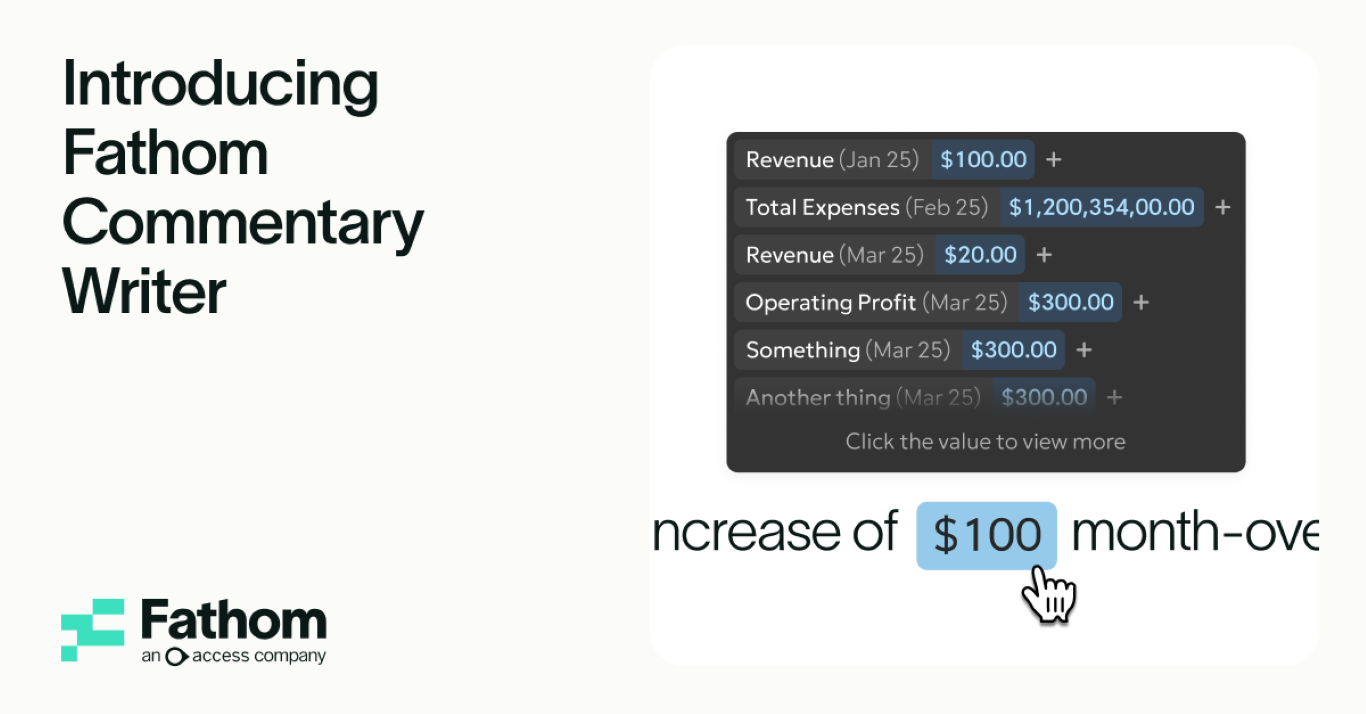
In Fathom's Actual vs Budget table, you can see exactly where variances sit at the line-item level, with the variance amount and percentage shown for each row. Walk through each material variance and tag it as timing or structural in your commentary. The board doesn't need you to explain every 2% fluctuation. They need you to flag the ones that matter and tell them which category they fall into.
Telling your board that revenue is 8% behind plan is incomplete without the next sentence: "Here's what we now expect for the full year."
Use Forecast Snapshots to compare your original annual budget with the updated reforecast. In a table view, you can present Actual vs Budget vs Forecast Snapshot side by side, with variances calculated between them. This shows exactly how the picture has shifted: which months have moved, which numbers have changed, and what the new full-year landing zone looks like.
The variance tells you where you've been. The reforecast tells you where you're going. Boards need both, and they need to see them together.
If the reforecast still shows you landing within 2% of the annual plan, say that upfront. If it shows a 10% gap, say that too, and explain what levers you're pulling to close it. Both are honest. Both build trust.
Board members are often presenting your numbers to other people: investors, parent company leadership, advisory boards. If your report is a table without context, the story gets lost in translation.
Use Fathom's Commentary to build the narrative directly into the report. For each material variance, cover three things:
1. What happened: 'Revenue is $340K below plan for the quarter.'
2. Why: 'Two enterprise deals with confirmed close dates slipped from March to April.'
3. What it means: 'Full-year impact is minimal. Reforecast shows revenue landing within 2% of plan.'
When your board chair calls a shareholder and says "Revenue is slightly behind but it's a timing issue, the full-year outlook is intact," that's your words coming out of their mouth. That only happens when the narrative is already baked into the report.
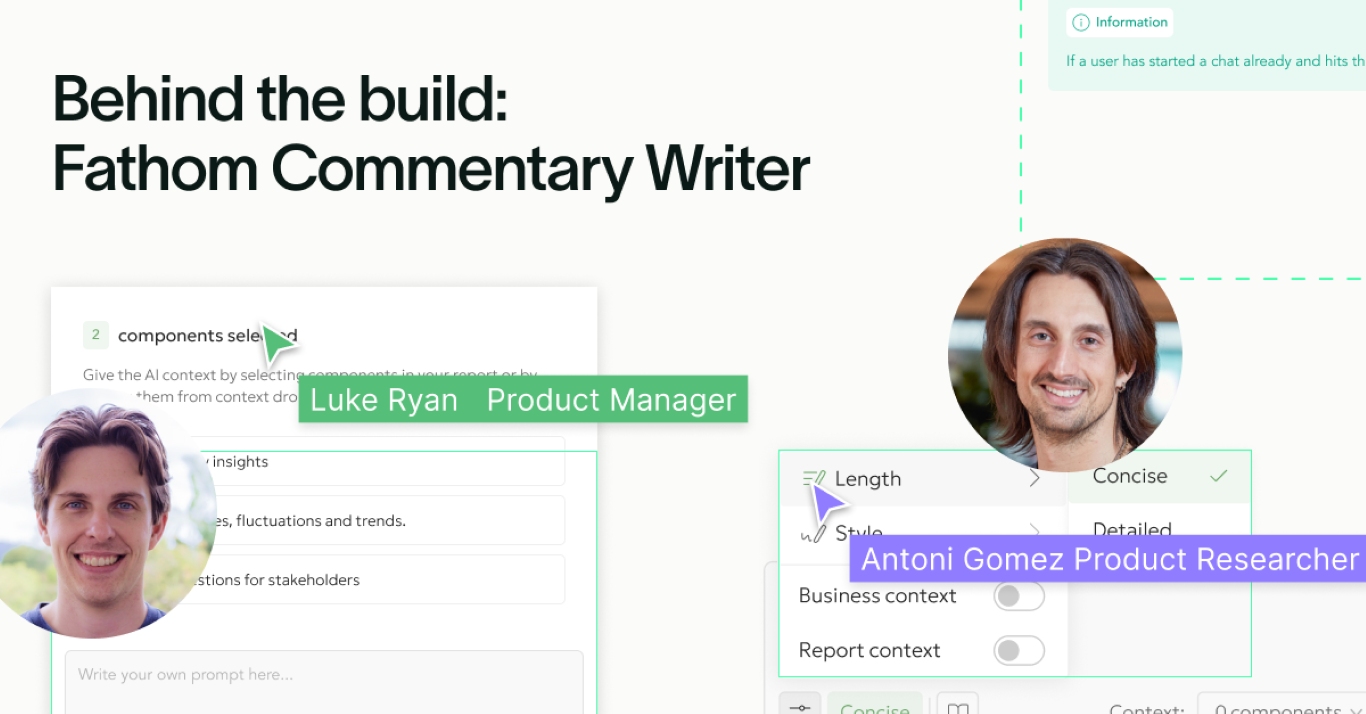
Context that powers the commentary
The variance report and reforecast give you the structure. But what makes Fathom's Commentary Writer useful for board reporting is the context you feed it. Two layers of setup turn generic variance commentary into narrative that sounds like it came from your finance team, not a template.
Business Context gives Commentary Writer the lens your board uses to evaluate performance:
Goal: "The company is targeting $12M ARR by end of FY27, up from $8.5M, to position for a Series B raise in early 2028."
Strategy: "Growth is driven by moving upmarket into enterprise accounts with longer sales cycles (90-120 days) but higher contract values ($80K+ ACV). The SMB segment is being maintained but not actively expanded."
Other: "The board meets quarterly and includes two investor representatives who focus on burn rate, pipeline coverage, and path to profitability. They want to see variances explained, not just reported."
Report Context captures what happened this specific period that explains the variance:
"Two enterprise deals totaling $340K in ACV slipped from March to April. Both have signed LOIs and confirmed close dates. The VP of Sales hired in February is ramping and not yet contributing to pipeline. Marketing spend was front-loaded for a Q3 event that drove registrations but won't convert to pipeline until next quarter."
With this in place, Commentary Writer doesn't just flag that revenue is 8% behind plan. It explains that the shortfall is concentrated in two identified deals with confirmed timelines, notes that the enterprise strategy deliberately carries longer close cycles, and frames the marketing spend as a pipeline investment rather than an overspend. That's the version your board chair can repeat to investors without calling you first.
Without Fathom: You email the board a variance table the night before the meeting. Revenue is -8%. Three board members reply with different versions of the same question: "Should we be worried?" You spend the first 20 minutes of the meeting explaining the gap is mostly timing. One board member isn't convinced. Another asks you to reforecast. You promise to send an updated version by Friday. The strategic discussion you'd planned for the second half of the meeting never happens.
With Fathom: You open the meeting with a short narrative: revenue is 8% behind plan, it's timing not structural, and here's the reforecast showing full-year landing within 2% of plan. The board reads it, looks at the side-by-side snapshot comparison, and moves on. Five minutes in, you're already past the variance conversation and into what actually matters: where to invest in Q4, whether to accelerate hiring, how to position for next year. Same board, same numbers, completely different meeting.
Finance leaders who present variance reports with built-in narrative and reforecast context spend less time fielding reactive questions in board meetings. The survey backs this up: the most confident users are 1.6x more likely to use forecasting alongside their standard reporting, and 2x more likely to combine multiple Fathom features.
When you tell the story before the board asks for it, you shift the conversation from "Why are we behind?" to "What are we doing about it?" And that's the meeting your board actually wants to have.

Ellie is a campaign marketing manager at Fathom, with a degree in branding and marketing. With a background in campaign strategy and creation, Ellie is passionate about showcasing how Fathom can make a real difference to finance professionals and businesses.
Connects to your favourite accounting tools. No set up fee. No credit card required.
Try free for 14 days →Trusted by 100,000+ businesses worldwide
Get a clearer picture of your business performance and in-depth analysis of your numbers.
See all features
Live data from your favourite accounting tools in Fathom. No exports, no manual uploads, ever.
See all integrations
Trusted by 100,000+ businesses worldwide
Fathom connects your accounting tool automatically and handles the heavy lifting — so you can focus on what the numbers actually mean.
Try free for 14 days →No setup fee

No credit card
AI Commentary