May 11, 2026

Your board isn't actually asking for a forecast. When they say "What does the next 12 months look like?" they're really asking: Are we going to be OK? What could go wrong? And what are we doing about it?
In Fathom's State of Financial Storytelling 2026 survey, forecasting and projections was the #1 question theme from boards and investors, cited by 35% of in-house finance leaders. But the actual questions tell a more specific story:
"Cash balance in 12 to 18 months based on 3 different scenarios." (CFO, Technology, AU)
"What are our biggest risks to the model over the next 6 to 12 months?" (Finance Director, Technology, UK)
"What happens to the cash projection if we add or remove staff?" (Finance Manager, Technology, US)
"Are variances timing or structural?" (Finance Director, Technology, UK)
These aren't requests for a spreadsheet with 12 columns. They're requests for a story: where are we headed, what are the risks, and how confident should we be?
Start with the 3-Way Forecast in Fathom. P&L, balance sheet, and cash flow in a single forward-looking view. It answers three questions at once: Are we profitable? Can the balance sheet support growth? And do we have the cash to get there?
Your actuals sync automatically from integrated accounting platforms, so the forecast always starts from real numbers, not last quarter's assumptions. When your board asks "How current is this?" you can say "It's based on actuals through last Friday."
Build your baseline using the assumptions you believe are most likely. Revenue growth at X%, headcount at current levels, known expenses locked in. Resist the urge to make it optimistic. Boards trust the finance leader who gives them the realistic number first.
A single forecast answers "What do we expect?" Boards want to know "What could happen?"
Create two additional Scenarios alongside your baseline:
Upside: What if the pipeline converts at a higher rate, or that large deal closes in Q3?
Downside: What happens if revenue comes in 15% below plan, or we lose a key customer?
Scenarios let you compare each version side by side in a chart view. Instead of presenting a single line that everyone silently questions, you're presenting a range that acknowledges uncertainty and shows you've thought through the risks.
That's the difference between a finance leader who reports numbers and one who tells a story. The scenario comparison says: "Here's where we expect to land, here's the upside if things go well, and here's how much cushion we have if they don't."
Boards don't just want to know where you'll be in 12 months. They want to know how you get there and whether the path is stable or volatile.
Pull up an Actual vs Budget table to show how this quarter has tracked against plan. If you're behind on revenue, explain whether it's timing or structural. If you're ahead on profitability, explain why and whether it's sustainable.
Then layer in Forecast Snapshots to show how the outlook has shifted since the last board meeting. If you forecasted $2.4M in Q3 revenue two months ago and the current forecast shows $2.1M, the board needs to know that, and they need to know why. Presenting snapshots in a table view makes the shift visible and gives you the structure to explain it.
The most confident finance leaders in the survey share one habit: they don't wait for "What does this mean?" They answer it upfront.
Use Fathom's Commentary to add a summary to each section of the forecast:
"Revenue is tracking 6% below plan for the quarter. Two enterprise deals originally expected in March have slipped to April based on updated close dates. If both close as expected, full-year revenue remains within 2% of plan."
The board doesn't need to ask whether the shortfall is a problem. You've already told them it's timing, quantified the impact, and laid out the path back to plan.
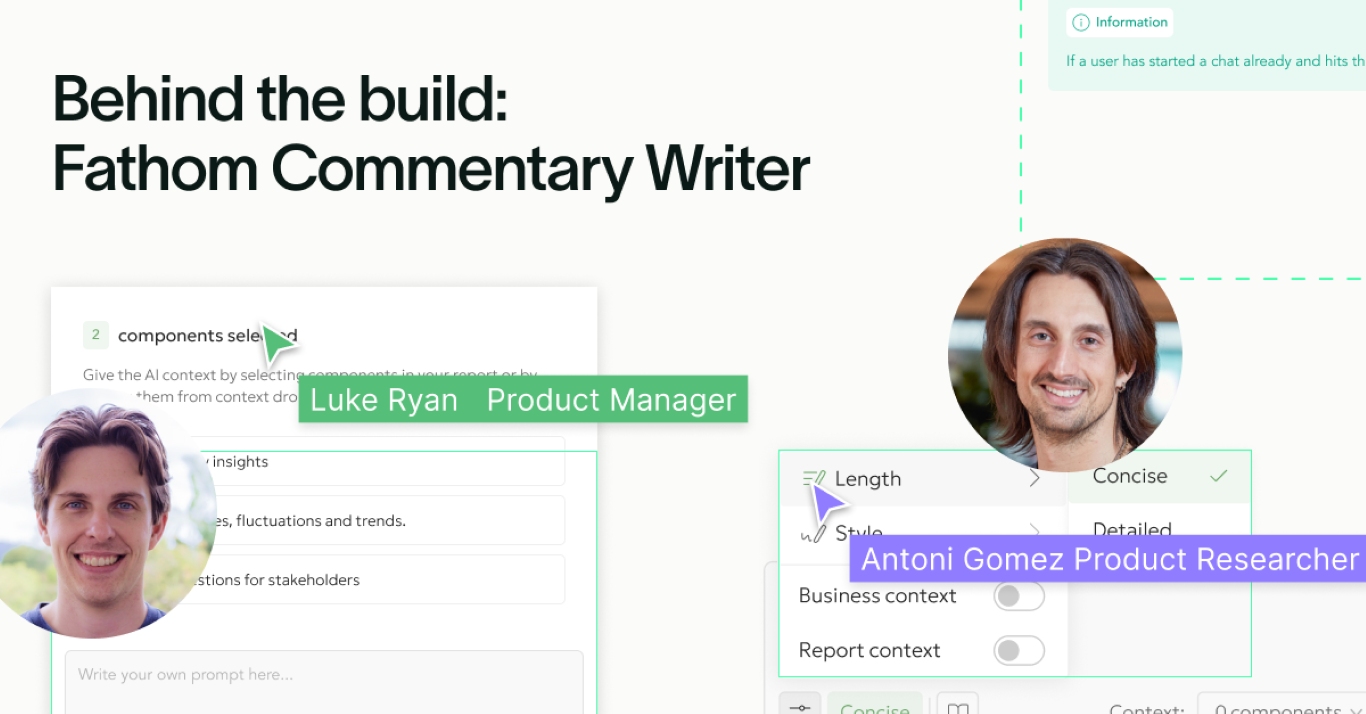
That commentary didn't write itself from the numbers alone. Commentary Writer produces board-ready narrative when you've set up the right context. Here's what makes the difference for a forecast conversation.
Business Context gives Commentary Writer the strategic lens your board cares about:
Goals: "The business intends to reach $12M ARR by end of FY27 and achieve cash-flow breakeven by Q3 2027. The board is evaluating a potential Series B raise in early 2028."
Strategy: "Growth is driven by expanding average contract value in mid-market accounts. The sales team is shifting from high-volume SMB outbound to a smaller number of larger enterprise deals with longer close cycles."
Market: "The competitive landscape is intensifying, with two well-funded competitors entering the mid-market segment in the past 12 months. Win rates have been stable but deal cycles are lengthening."
Other: "Our stakeholders are the board. Focus on risk exposure, forecast credibility, covenant headroom, and assumptions behind variances. Highlight what they're most likely to question."
Report Context flags what's different this period:
"Two enterprise deals ($180K and $160K ACV) originally expected to close in March have slipped to April based on procurement delays on the customer side. Pipeline coverage for Q4 remains at 3.2x. We also hired a VP of Sales in February who hasn't yet ramped."
With this in place, Commentary Writer connects the revenue shortfall to the enterprise strategy shift and longer deal cycles, rather than flagging it as a growth problem. It notes that the pipeline coverage is strong and frames the new VP hire as a deliberate investment, not just a cost increase. That's the kind of narrative your board reads once and understands, instead of spending the first 20 minutes of the meeting asking you to explain it.
Without Fathom: You spend two days before the board meeting building a forecast in Excel. You present a single set of numbers. The board asks what happens if revenue comes in lower. You say you'll model that and get back to them. Another day rebuilding the spreadsheet. By the time you send it, the board has already moved on and made the decision without you.
With Fathom: You walk into the board meeting with three scenarios already built. The board asks what happens if revenue comes in lower. You pull up the downside scenario on screen. Cash runway, margin impact, monthly trajectory, all right there. The conversation shifts from "Can you model that?" to "Given these numbers, here's what we should do." The board leaves with a decision, not a follow-up request.
1. 3-Way Forecast summary: P&L, balance sheet, and cash for the next 12 months.
2. Scenario comparison: Baseline, upside, and downside side by side.
3. Actual vs Budget table for the current period, with commentary explaining material variances.
4. Cash runway: Months of cash remaining for each scenario using Forecast Snapshots.
5. Key assumptions listed, so the board knows what's driving the numbers.
The survey data backs this up: 75% of respondents say Fathom helps them answer their toughest questions. And the finance professionals who report the highest confidence are 1.6x more likely to use forecasting and 2x more likely to combine multiple feature categories.
A single P&L forecast on a spreadsheet doesn't build board confidence. A forward-looking view that shows the range of outcomes and tells the story behind the numbers does.

Ellie is a campaign marketing manager at Fathom, with a degree in branding and marketing. With a background in campaign strategy and creation, Ellie is passionate about showcasing how Fathom can make a real difference to finance professionals and businesses.
Connects to your favourite accounting tools. No set up fee. No credit card required.
Try free for 14 days →Trusted by 100,000+ businesses worldwide
Get a clearer picture of your business performance and in-depth analysis of your numbers.
See all features
Live data from your favourite accounting tools in Fathom. No exports, no manual uploads, ever.
See all integrations
Trusted by 100,000+ businesses worldwide
Fathom connects your accounting tool automatically and handles the heavy lifting — so you can focus on what the numbers actually mean.
Try free for 14 days →No setup fee

No credit card
AI Commentary