June 13, 2025
.png)
As an advisor, you're juggling dozens—maybe hundreds—of clients who each have their own financial story and potential for growth. Some of your clients are performing well, while others are not. How do you get a clear picture of all your clients, understand their performance, and know how to help them?
We built the Insights Dashboard to give you complete visibility of all your clients' business performance. It gives you a clear view across your portfolio, letting you generate key insights and use those insights to deliver targeted services to your clients.
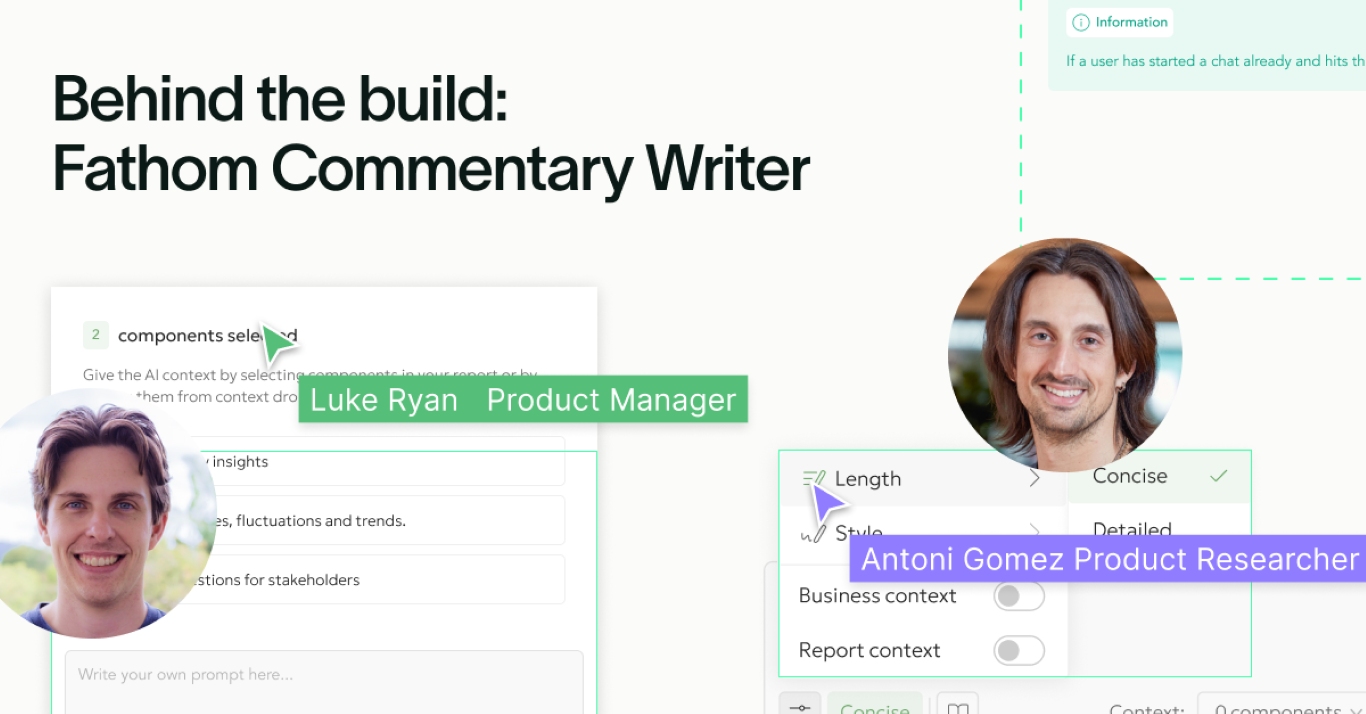
In this article, Fathom's resident chartered accountant, Antoni Gomez ACA, demonstrates how you can use the Insights Dashboard to:
We’ll show you how to solve the following problems:
Problem 1: How do I proactively keep track of all my clients' business performance quickly and simply?
Answer: Upload all your clients into the Insights Dashboard to spot trends, problems, and opportunities across your entire client portfolio, using custom fields such as thresholds, cash health, and growth.
Problem 2: How do I prioritise which clients to follow up and help?
Answer: The Insights Dashboard lets you use data-driven filters to confidently identify clients and target those clients that need your help most.
Problem 3: How can I meaningfully engage my clients without overwhelming them?
Answer: Quickly generate summary reports through the Insights Dashboard to engage clients, guide targeted client conversations, and help clients confidently navigate the next timely step in their business journey.
At the end of the article, you’ll find helpful tips for setting up your Insights Dashboard to have the most impact.
Learn three ways to use the Insights dashboard to monitor your client base and take action when you spot client problems or opportunities as they occur.
In this video, Antoni demonstrates three examples:
Fathom’s Insights Dashboard replaces the need for manual spreadsheet analysis and gives you valuable insights across your portfolio of clients. You can use this information to work out what services you can confidently offer to your clients and what your next conversation with that client should focus on.
In this video, you'll learn three ways to use the Insights dashboard to identify specific clients who need your help or present opportunities to deliver expanded services.
We showcase these three examples:
The Insights Dashboard helps accountants move beyond relying on individual client managers needing to remember everything, to instead use data-driven filters and thresholds to systematically and confidently identify opportunities.
Once your target clients are identified, you can then create individual client reports for meaningful conversations about expanding services and building a potential pipeline from basic compliance work to higher-value advisory services. More on this below.
Find out how you can offer more services to clients who might typically receive basic compliance services. In this example, we show you how to filter down a portfolio of clients to six tax compliance clients that Antoni manages and quickly create summary reports for each client.
This video shows you three approaches:
The Insights Dashboard gives you a way to differentiate your firm's services, strengthen client relationships, reduce price pressure, and potentially open doors to additional services throughout the year.
The purpose of management reporting isn't only to explain the past; it's to help make business-critical decisions. With Fathom's Insights Dashboard, you’re not just presenting numbers, you’re helping navigate the future so clients take their next step with confidence. Ready to dive in?
Set yourself up for success with these helpful starting tips for setting up the Insights Dashboard so you can confidently begin.
Tags are important for creating customisable groupings and allocations that allow you to separate clients and filter the Insights Dashboard view.
Once you’ve set up tags and thresholds, have a think about your process for using the Insights Dashboard.

Keren is Fathom’s Marketing and Communication Manager. She’s inspired by the stories and learnings of Fathom's customers who are dedicated to helping the people behind every business. Keren’s background is in corporate communication and management consulting.
Connects to your favourite accounting tools. No set up fee. No credit card required.
Try free for 14 days →Trusted by 100,000+ businesses worldwide
Get a clearer picture of your business performance and in-depth analysis of your numbers.
See all features
Live data from your favourite accounting tools in Fathom. No exports, no manual uploads, ever.
See all integrations
Trusted by 100,000+ businesses worldwide
Fathom connects your accounting tool automatically and handles the heavy lifting — so you can focus on what the numbers actually mean.
Try free for 14 days →No setup fee

No credit card
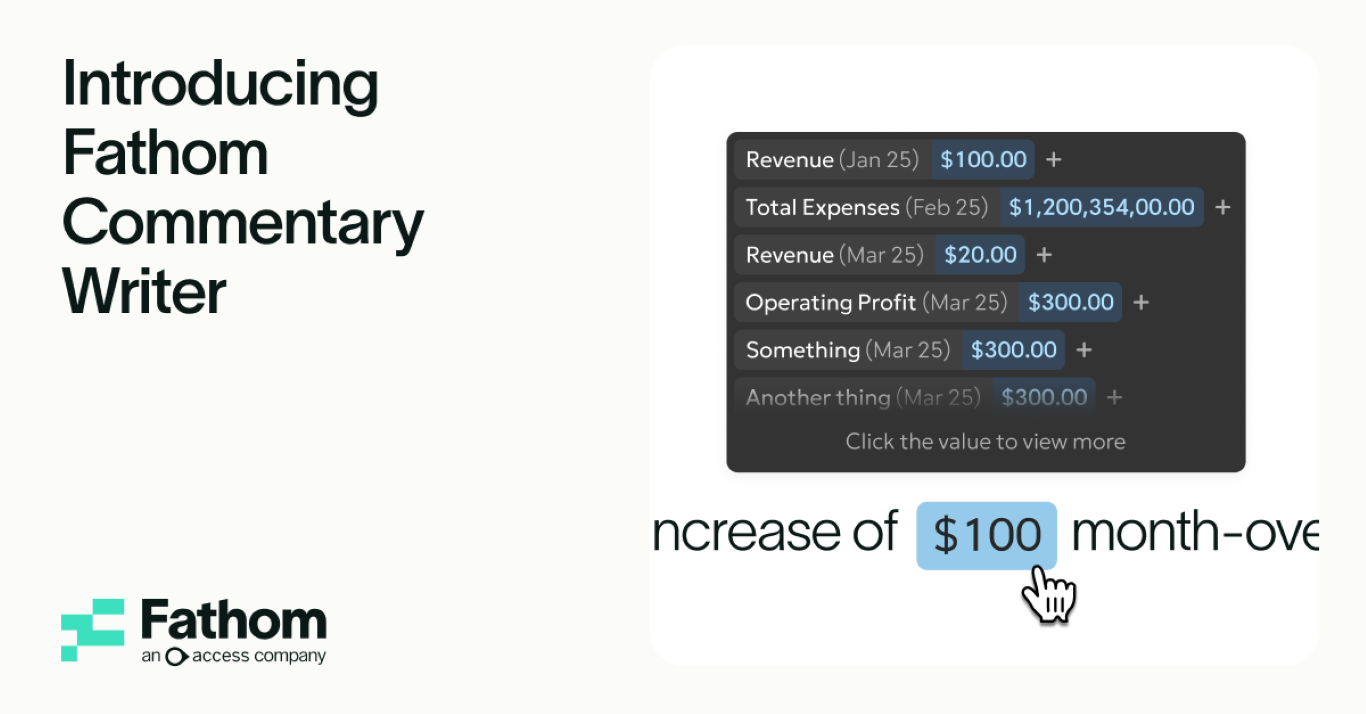
AI Commentary