June 11, 2025

From rising costs to slower sales, your clients are navigating a more fragile financial environment. Growth is still on the radar, but it’s being weighed against a far more pressing question:
“Can we afford this, now and six months from now?”
In our survey with 200+ advisors globally, a common theme has emerged: clients are more financially anxious and analytically aware than ever before.
Clients are asking:
“What’s our cash position?”
“What’s our break-even point?”
“What does that mean for hiring or expansion?”
“Can we extend our runway or should we raise capital?”
“What happens if costs increase or revenue slows?”
This is no longer just financial reporting. It’s real-time business-critical decision support.
Leading advisors are stepping in with data-backed clarity, helping clients to accurately:
Here’s what we heard from the advisors we surveyed:
“Detailed forecasts using Fathom help us show different outcomes clearly.”
“More detailed conversations. Clients are caring more about their financial situation. Worried.”
“We’re creating monthly reports with cash flow, budgets, and forecasts.”
Here’s how to walk clients through cash flow questions in real-time:
Read up more on scenarios vs microforecasts here.
This helps clients see, not just hear what’s at risk and what’s possible.
Discover how advisors are using forecasting tools to cut through the fog.
Ready to deliver insights that make a difference? Start your free 14-day trial of Fathom today.

Ellie is a campaign marketing manager at Fathom, with a degree in branding and marketing. With a background in campaign strategy and creation, Ellie is passionate about showcasing how Fathom can make a real difference to finance professionals and businesses.
Connects to your favourite accounting tools. No set up fee. No credit card required.
Try free for 14 days →Trusted by 100,000+ businesses worldwide
Get a clearer picture of your business performance and in-depth analysis of your numbers.
See all features
Live data from your favourite accounting tools in Fathom. No exports, no manual uploads, ever.
See all integrations
Trusted by 100,000+ businesses worldwide
Fathom connects your accounting tool automatically and handles the heavy lifting — so you can focus on what the numbers actually mean.
Try free for 14 days →No setup fee

No credit card
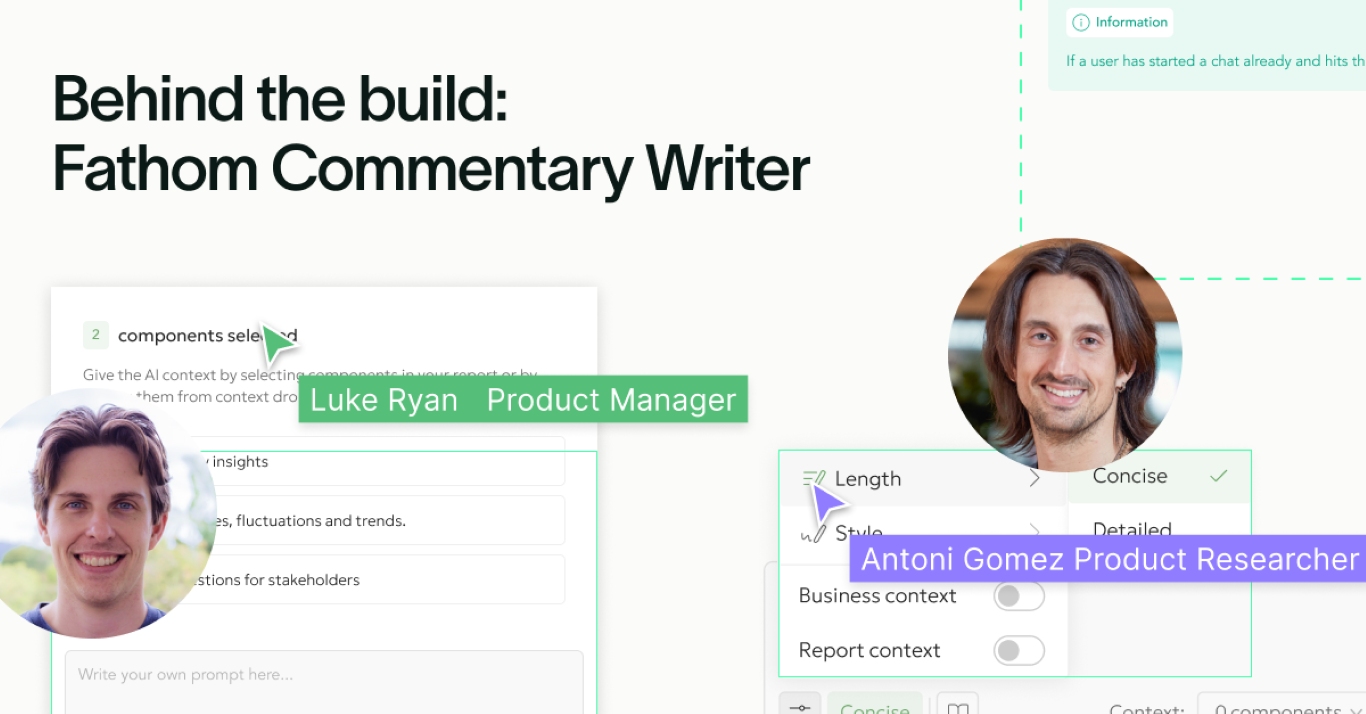
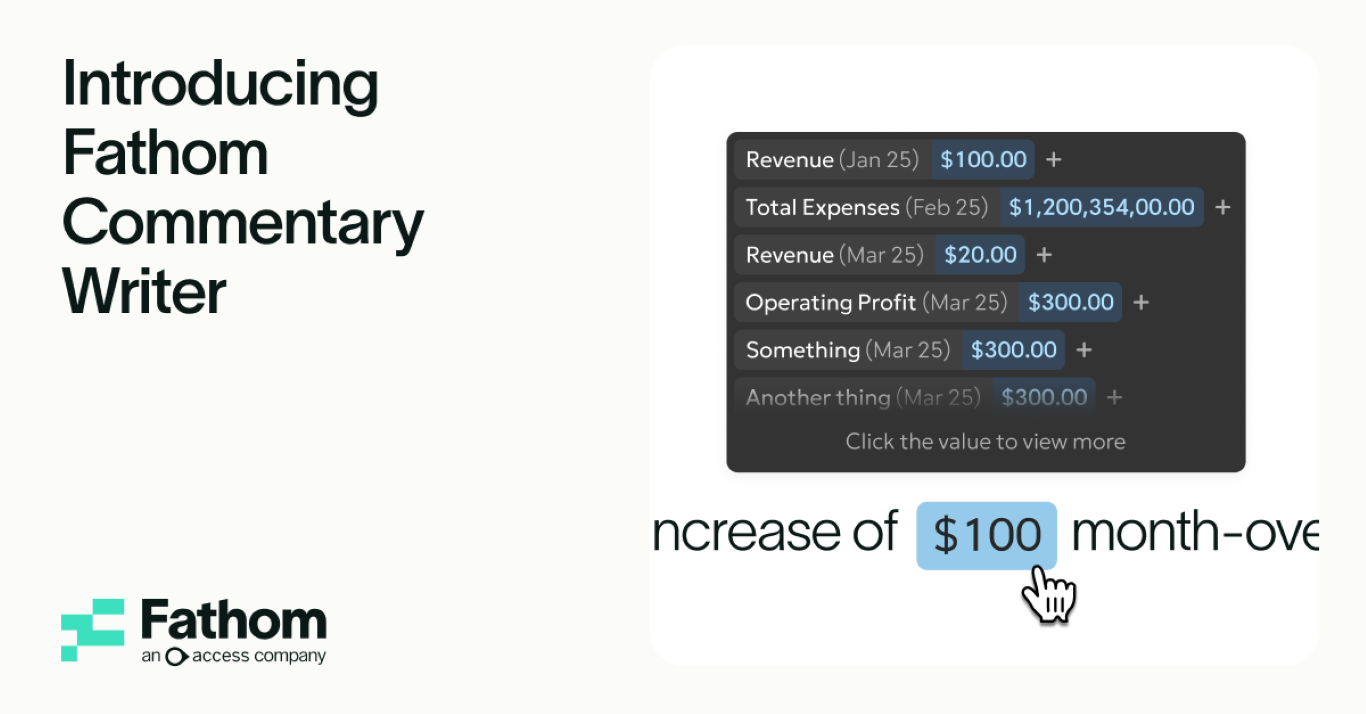
AI Commentary