Summary
MAP’s Monthly Management Accounts report is designed to provide a clear, consistent, and actionable view of a client’s financial performance every month.
By combining core financial statements with tailored KPIs, variance analysis, and narrative commentary, it transforms raw data into insights that drive better conversations and decisions. This report is highly structured and repeatable, making it ideal for firms that want to scale advisory without sacrificing quality or personalisation.
What’s included:
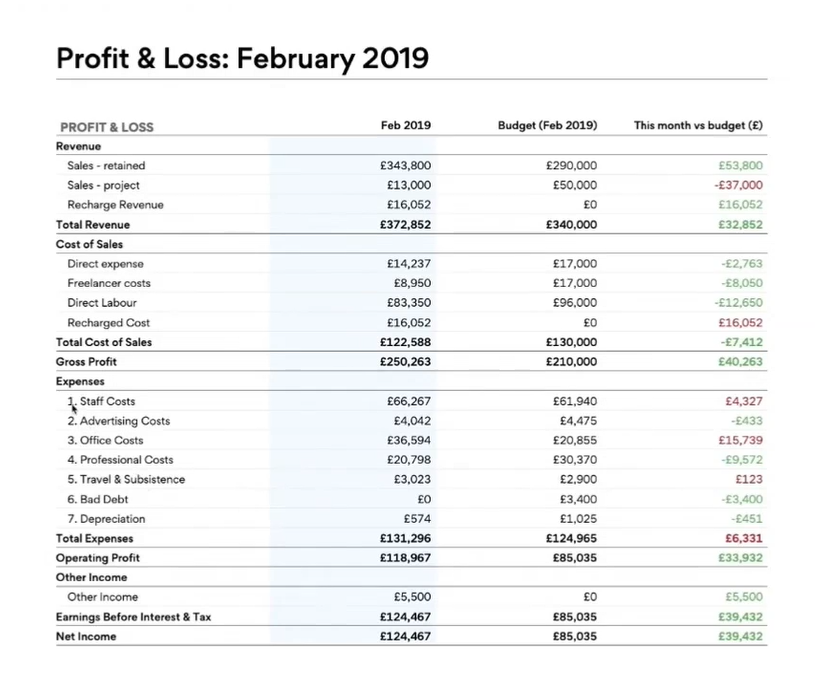
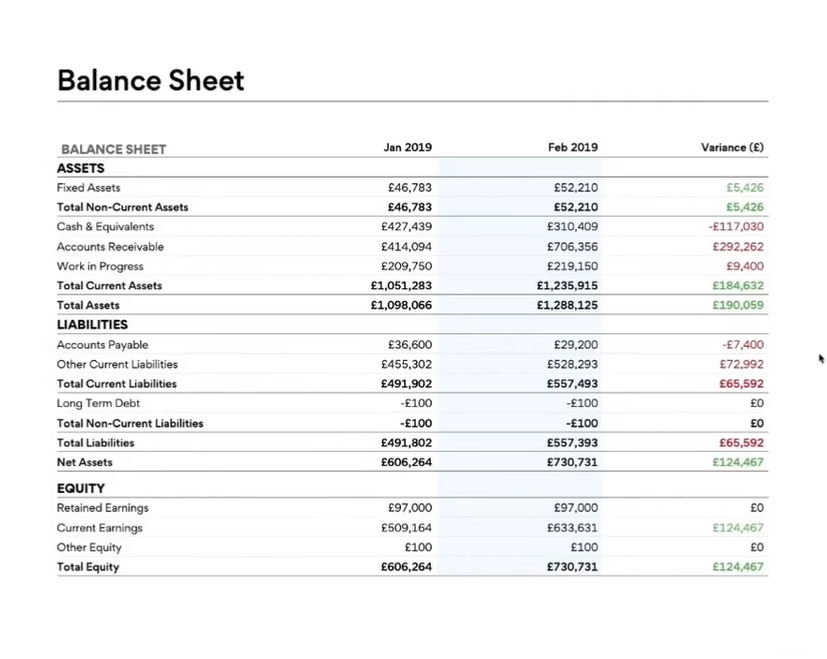
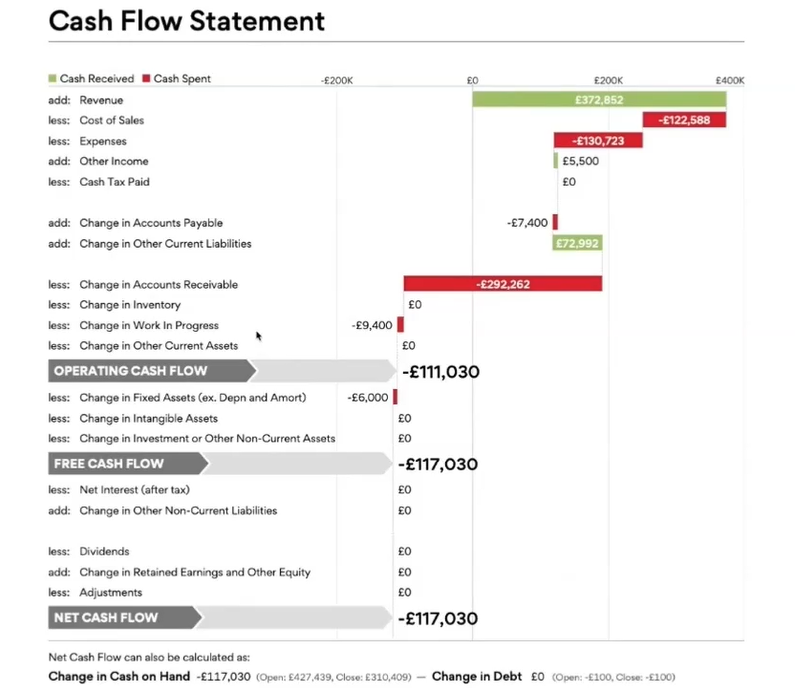
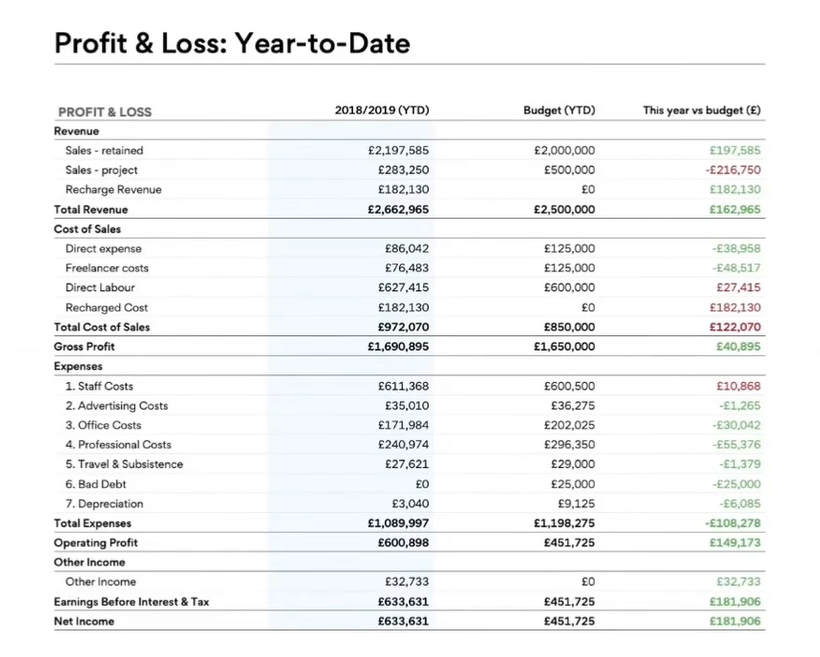
- Core financial statements (P&L, Balance Sheet, Cash Flow)
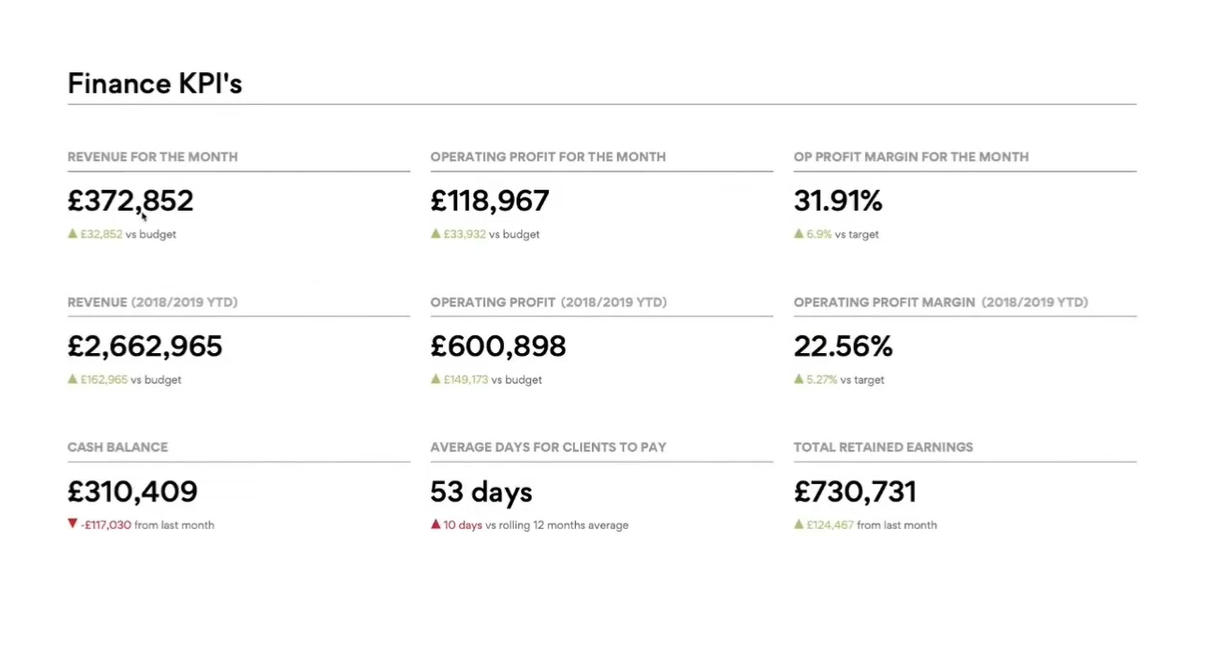
- KPI analysis with commentary
- Variance analysis (budget vs actuals)
- Customised dashboards for client industries
- Narrative commentary to give context and recommendations
Why it’s effective:
These reports do more than just present numbers, they tell the story of the business each month. With a mix of financial statements, tailored KPIs, and clear commentary, clients can see not only what happened but why it matters.
The automation behind the templates means the MAP team spends less time compiling data and more time focusing on meaningful conversations. Over time, this consistency builds confidence and trust, turning monthly reporting into a valuable decision-making tool.
Designed for:
- Accounting firms delivering monthly reporting at scale
- Advisors who want to combine compliance with advisory
- Firms that need to standardise reporting across many clients
How to create this report in Fathom
1. Connect your data.
Start by integrating your accounting platform of choice (Sage, QuickBooks Online, MYOB, Xero, Access Financials or even Excel and Google Sheets) into Fathom and import your client’s budget. This ensures that the foundations are in place for budget vs actual analysis later.
2. Build the framework.
Create a new report template in Fathom. Add a professional cover page, table of contents, and space for an executive summary. This framework becomes the structure you’ll reuse each month.
3. Add the financials.
Insert Profit & Loss, Balance Sheet, and Cash Flow components. Rather than a plain dump of numbers, configure them to show trends; monthly movements, year-to-date totals, or quarterly comparisons.
4. Layer in analysis.
Bring in budget vs actual reporting and variance analysis charts. These sections highlight where the business is tracking well and where corrective action may be needed. Trend charts can add further context.
5. Customise KPIs and dashboards.
Select the KPIs that matter most to the client. You can use Fathom’s library or create formulas tailored to their industry, such as utilisation rates for agencies or recurring revenue for SaaS firms. Present these with dashboards, charts, and gauges that make performance easy to understand.
6. Add narrative and action items.
Use text components to explain the story behind the numbers and point out risks or opportunities. Close the report with recommended actions or discussion points so that the pack leads naturally into a management conversation.
7. Automate and scale.
Once the report is complete, save it as a template. Apply it across multiple clients for consistency and schedule automatic delivery each month. This ensures the process is efficient without losing the personalised insights.
Customer spotlight
Paul Barnes, Managing Director & FCCA, MAP
Paul is the Managing Director of MAP, an award-winning accountancy firm that specialises in helping digital and creative agencies build confidence in their numbers. With over 11 years of experience, Paul has developed a structured approach known as The Financial Maturity Curve, a proven framework that evolves with the business and delivers a truly exceptional finance function.
MAP uses Fathom as a core part of their toolkit to produce clear, actionable management accounts, detailed forecasts, and their signature Commercial Health Check. By combining tailored KPIs with a visual reporting format, Paul and his team help business owners understand where they are, where they want to be, and what steps they need to take next.
“This report helps our clients understand their business performance visually, without needing to be financial experts. It brings confidence to every decision.”
Find out more about MAP’s Financial Maturity Curve framework. Watch Paul’s full Expert Series episode here.