
Summary
A consolidated report designed for multi-entity businesses needing visibility across stores, divisions, or revenue streams. Built in Fathom, this format blends financials, operational KPIs, and commentary into a clear, visual performance story.
In this walkthrough, Jesse Chapman applies his real-world reporting format to a fictional business, Winston’s Pizzeria, to show how to connect frontline metrics with financial outcomes. Whether you're tracking order volume or debt ratios, this layout is designed for confident decision-making at board level.
What’s included:
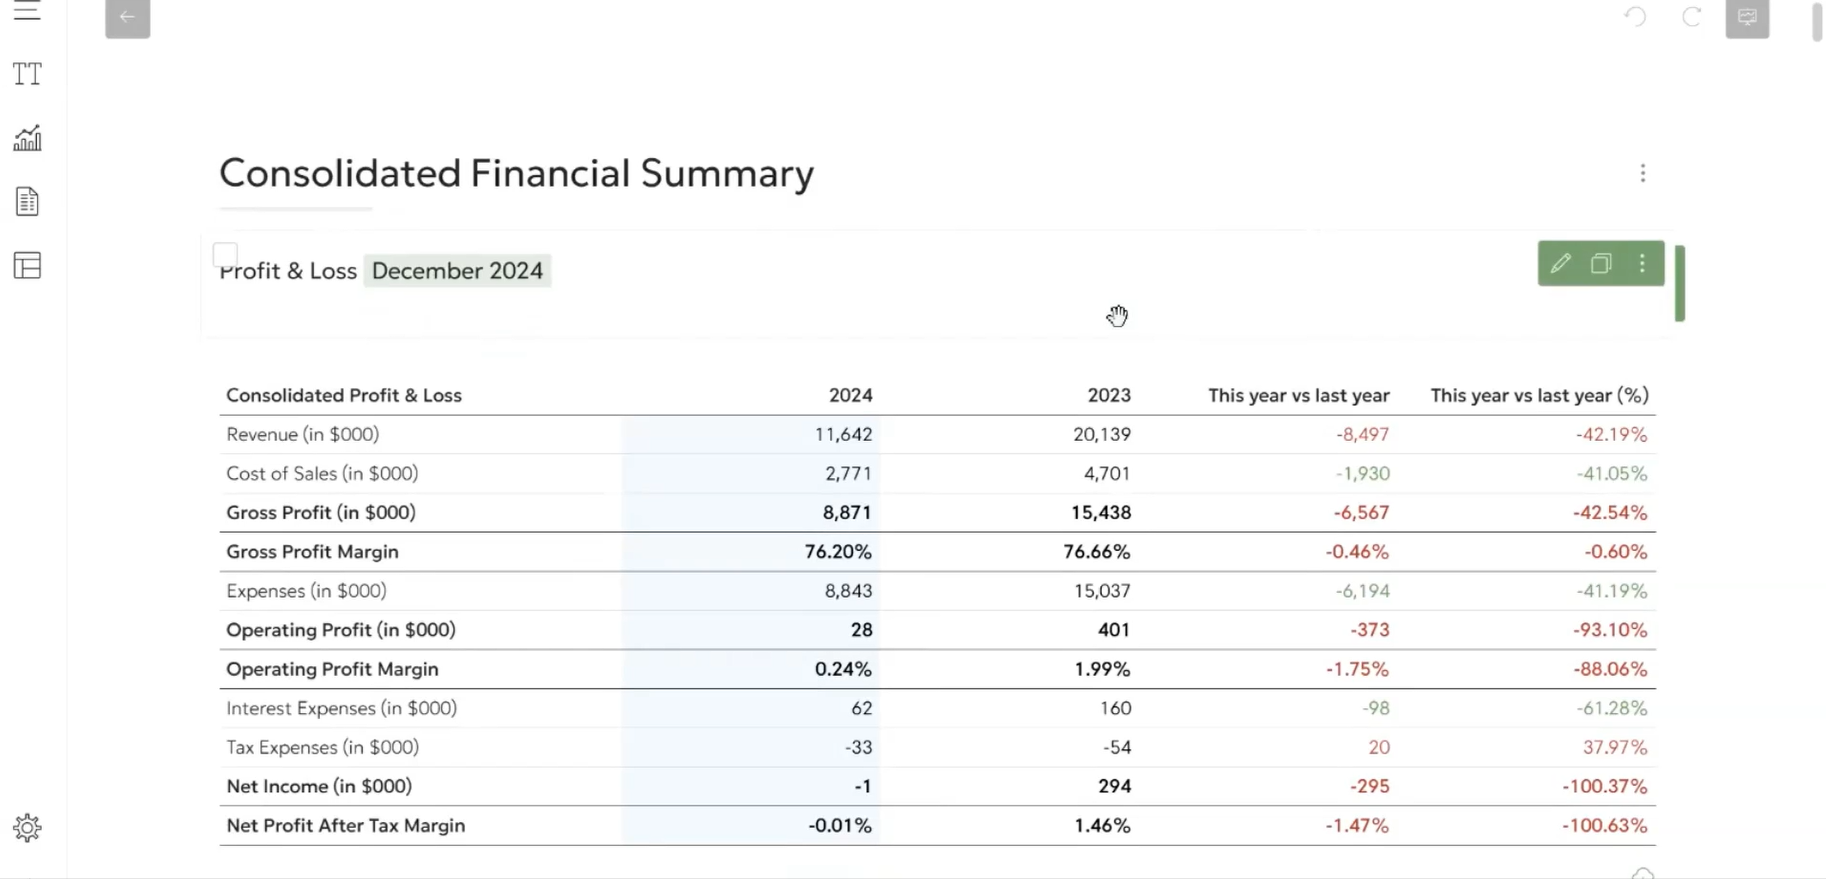
- Executive summary with consolidated P&L and balance sheet
- Entity-level revenue breakdown for benchmarking
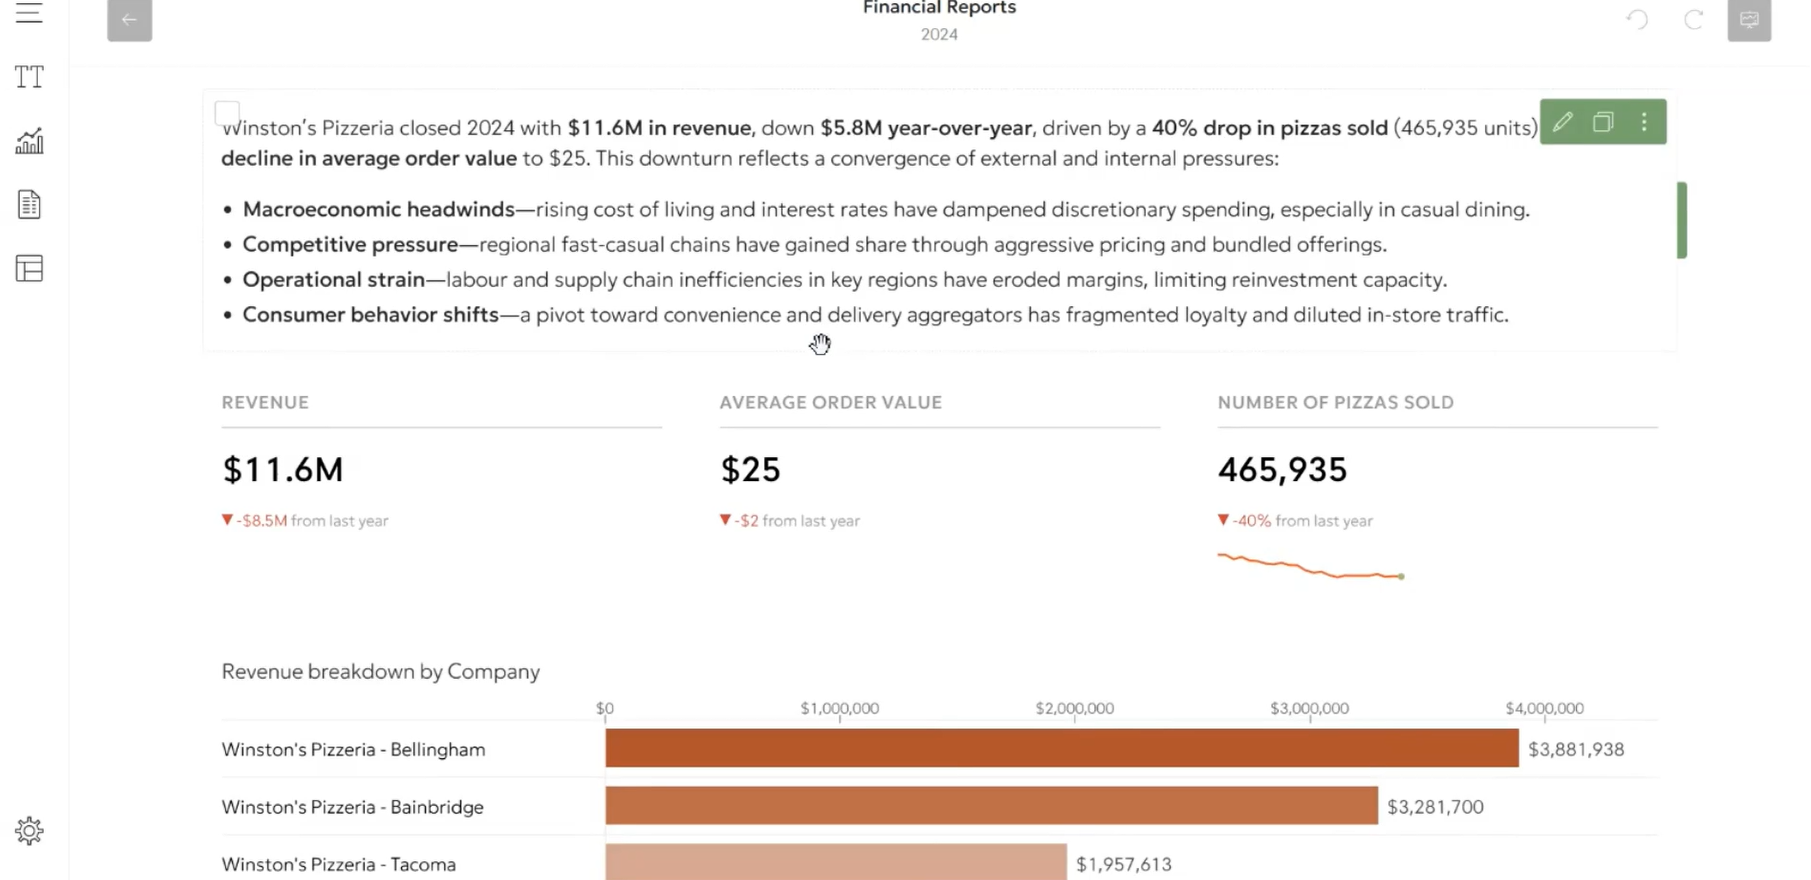
- Non-financial metrics: orders, average order value, inventory days
- Cost-per-order breakdown: labour, overheads, indirects
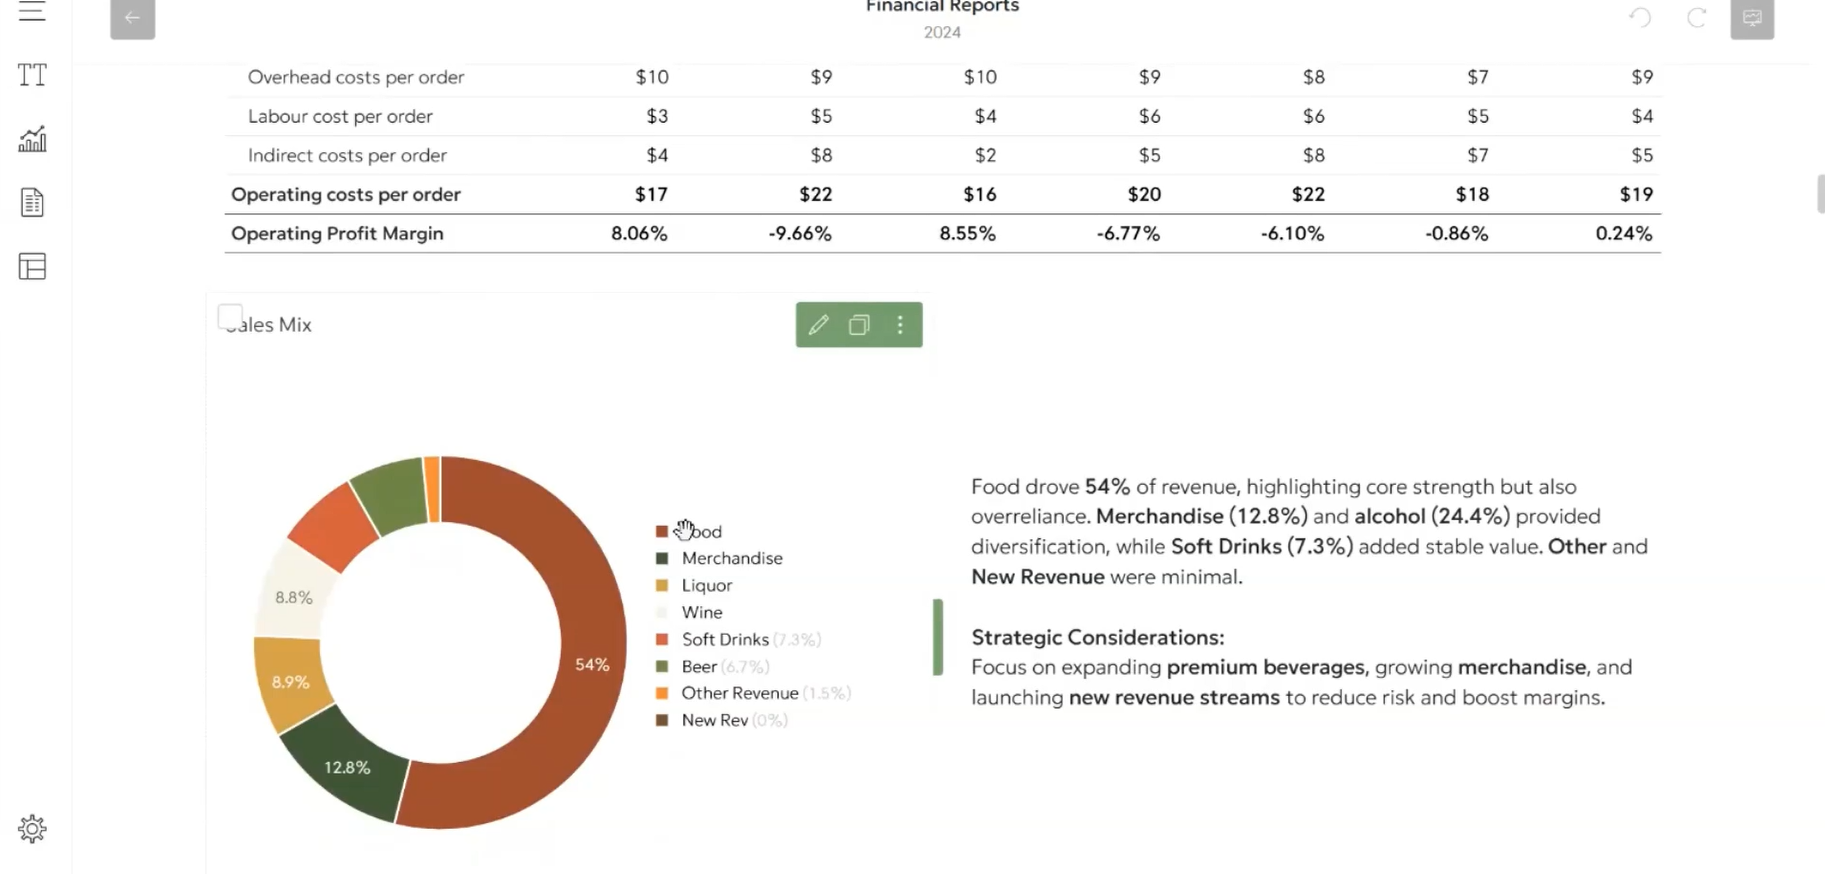
- Visual sales mix and commentary
- Breakeven and profitability analysis with recommendations
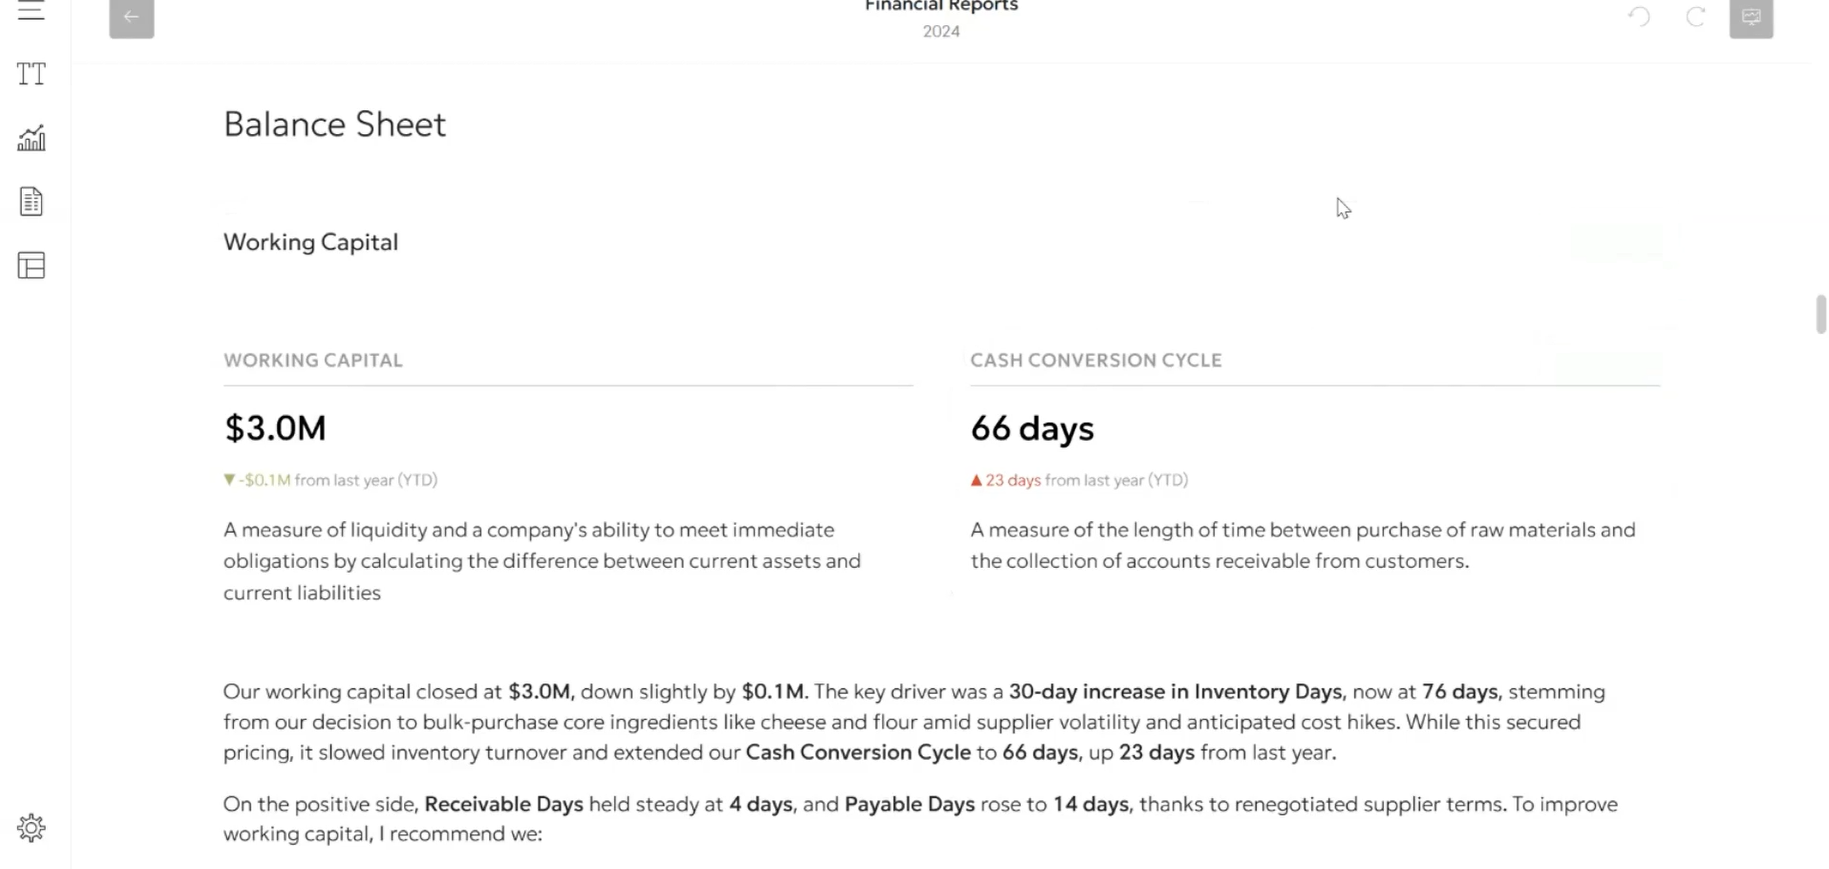
- Working capital insights: receivables, inventory, cash cycle
- Asset turnover and capital expenditure pages
- Capital structure: debt-to-equity, long-term debt, cash flow ratios
- Full financials (P&L and balance sheet) by entity
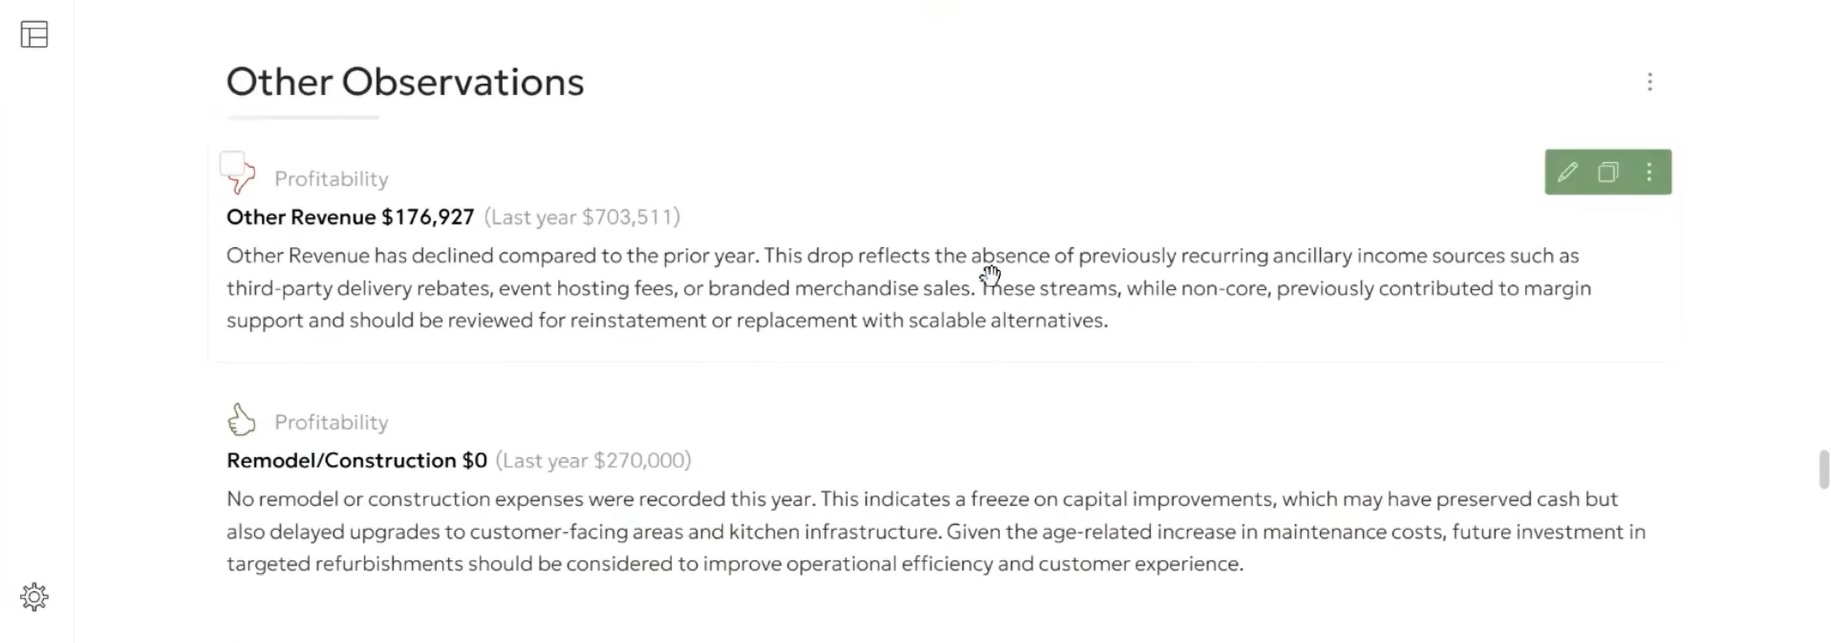
- End-of-report observations and board-ready commentary
Why it’s effective
- This format helps board members, operators, and advisors quickly see what’s working, and what’s not. By layering operational metrics (e.g. order volume, average cost per order) over financial results, the report provides real insight into business drivers, not just the bottom line.
- “One of the things I really like is breaking down average order value and volume, then connecting that to cost and labour per order. That’s where we can really start making decisions.”
- It’s a format built to provoke smart questions, spot red flags early, and align teams around key drivers of performance.
Designed for
- Multi-entity businesses (retail, hospitality, franchises, etc.)
- CFOs and controllers producing board reports
- Fractional or in-house finance teams
- Firms that blend financial and non-financial performance tracking
How to create this report in Fathom
Jesse’s approach is grounded in clarity, not complexity. Here's how he builds a report that speaks to both financial and operational performance, without overwhelming the reader.
1. Start with a snapshot
Rather than diving straight into the numbers, Jesse opens with a simple, consolidated view of the P&L and balance sheet, just enough to give stakeholders a quick sense of performance and position. This top-level page sets the scene and sparks the right questions.
“It’s just a shorthand overview to open up the conversation. What’s working, what’s changed, and where do we dig deeper?”
2. Unpack the results
Next, Jesse expands on both the income statement and balance sheet across separate pages, offering deeper insights with supporting KPIs and commentary. He uses tailored operational metrics (like average order value or cost per order) to bring the numbers to life and explain what’s driving performance.
This is where he starts layering in meaning, not just what happened, but why.
3. Blend in operational data
Using non-financial KPIs is a key part of Jesse’s format. In Fathom, he adds custom metrics like number of orders, AOV, and labour per order to help benchmark performance across entities. These data points often reveal the real story behind a profit drop or margin squeeze.
“We’re able to break it down by entity and then layer in things like labour per order, indirect costs, and overhead. That’s when the patterns start to emerge.”
4. Benchmark across entities
Jesse includes a simple revenue breakdown by entity, giving an at-a-glance benchmark of who’s performing, who’s struggling, and what’s changed. From there, he builds out observations and commentary that highlight trends, outliers, and improvement opportunities.

5. Use visuals to clarify the story
Where possible, Jesse opts for visuals over raw tables: pie charts for sales mix, time series for asset turnover, KPI cards with thumbs up/down indicators. The goal? Help stakeholders engage with the data and get to the point faster.
“The visuals spark better conversations. They help the board ask the right questions without needing to scroll through pages of numbers.”
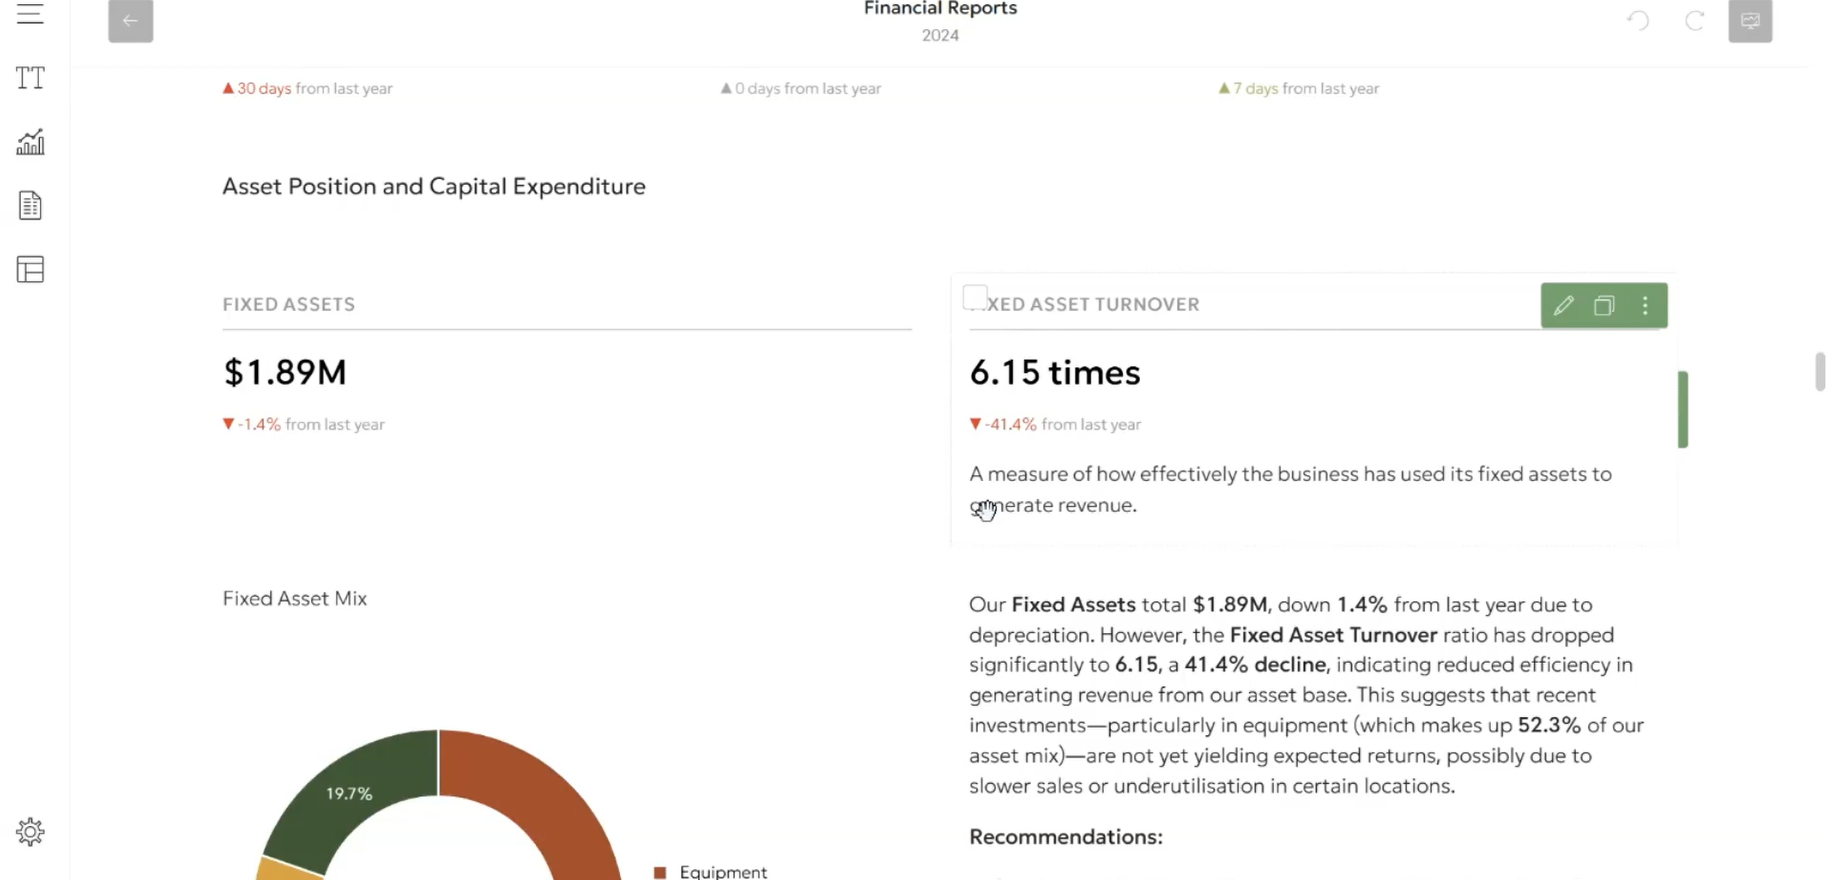
6. Highlight working capital and assets
Before presenting the full financials, Jesse takes a moment to spotlight key balance sheet areas; cash conversion, inventory days, CapEx trends, and debt ratios. These aren’t just metrics; they reflect operational health and capital planning.
He tracks how these have shifted year-on-year, flagging anything that might require a course correction.
7. Wrap with the full financials
Finally, the report includes a traditional view of the consolidated financials, followed by entity-level breakdowns and any additional commentary.
“By the time someone gets to the financial statements, they already understand the story, they’re just seeing the detail behind it.”
Customer spotlight
Jesse Chapman, Chartered Accountant and the Financial Controller at Harris Real Estate
Jesse Chapman is a Chartered Accountant and the Financial Controller at Harris Real Estate, one of South Australia’s leading property groups. With a background in banking and Big 4 audit, Jesse brings deep technical expertise and a sharp commercial focus to his role.
Jesse has overseen the finance integration of five mergers and acquisitions, implemented a new corporate services model with offshore support, and led multiple system migrations, including financial reporting in Fathom. His ability to streamline complex data across entities and present clear, high-level insights to the board has been critical in supporting Harris’s rapid growth.