
Summary
Jason Blumer's Financial Data and Benchmarks Monthly Report is a purpose-built advisory template designed to help digital agencies understand their financial performance through a coaching lens. Rather than overwhelming clients with granular data, this report strategically condenses the P&L into high-impact line items, pairs them with industry benchmarks, and presents trends that spark meaningful conversations.
The philosophy behind this report is simple: advisors have opinions. Instead of passively presenting numbers, this template empowers advisors to guide clients through what matters most, and deliberately exclude what doesn't. The result is a focused, repeatable framework that transforms monthly financials into a coaching tool.
What’s included:
- Summarised P&L condensed to key decision-driving line items
- Year-to-date columns for current year and prior year comparison Summarised P&L condensed to key decision-driving line items
- Monthly trending data (multiple months side-by-side for context)
Why it’s effective:
This report embodies a coaching philosophy that sets it apart from traditional management accounts. Here's what makes it work:
- Strategic simplification. By condensing the P&L to just the lines that drive decisions, the report removes noise and focuses attention where it matters. As Jason explains, "What you choose not to show the client is a key strategic piece—a lot of data distracts them."
- Always trending, never isolated. Numbers are never shown in isolation. Every metric includes multiple months plus year-to-date comparisons, giving clients the context they need to spot patterns.
- Coaching over explaining. The report is designed to flip the script. Instead of the advisor explaining numbers to the client, it prompts the advisor to ask: "Here's what the numbers say—can you explain them to me?" This approach builds ownership and accountability.
- Proprietary positioning. Because the template is custom-built, it becomes a differentiator. Clients can't get this exact report anywhere else, which elevates perceived value and strengthens the advisory relationship.
Designed for:
- Advisory firms
- Accountants who want to move beyond compliance into coaching conversations
- Firms looking to scale advisory services with a repeatable, templated approach
How to create this report in Fathom
1. Design your simplified chart of accounts mapping
Before building the report, identify the 8–12 P&L line items that truly drive decisions for your clients. For a lot of clients, this typically includes: Revenue, Labor (COS), Software and Client Costs, Gross Profit, Admin Expenses, Wages and Benefits, Owner Compensation, Professional Fees, Travel, Marketing, and Net Income. Map your client's detailed chart of accounts to these summary categories in Fathom.
2. Set up your benchmarks
Create custom KPIs in Fathom to calculate each line item as a percentage of revenue. Then establish benchmark targets based on your industry knowledge. These benchmarks become your "expert opinion" column in your report.
3. Build the financial statement section
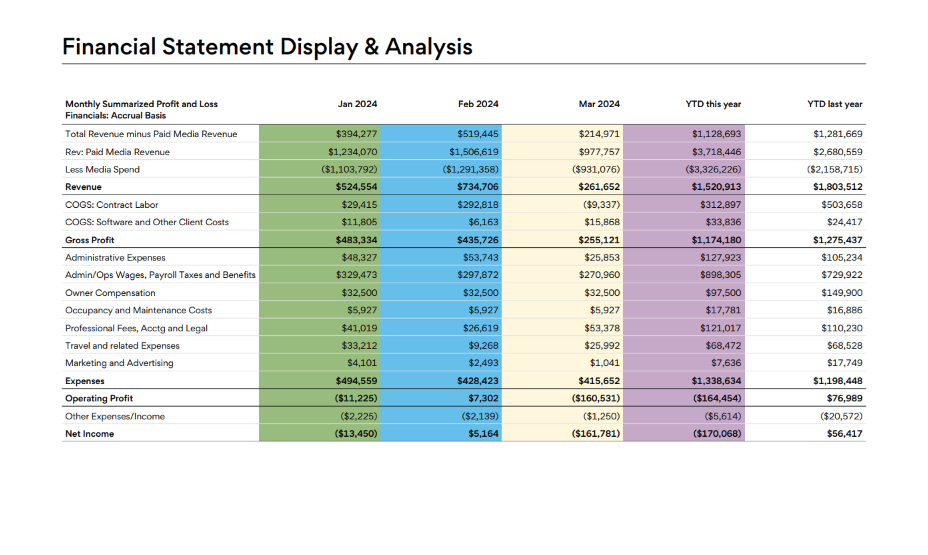
Create a new report template and add a summarized P&L table showing:
- Monthly columns (e.g., Jan, Feb, Mar)
- YTD This Year column
- YTD Last Year column
Use Fathom's table components to display both dollar amounts and percentage-of-revenue views. This dual presentation lets clients see absolute numbers alongside their relative weight in the business.
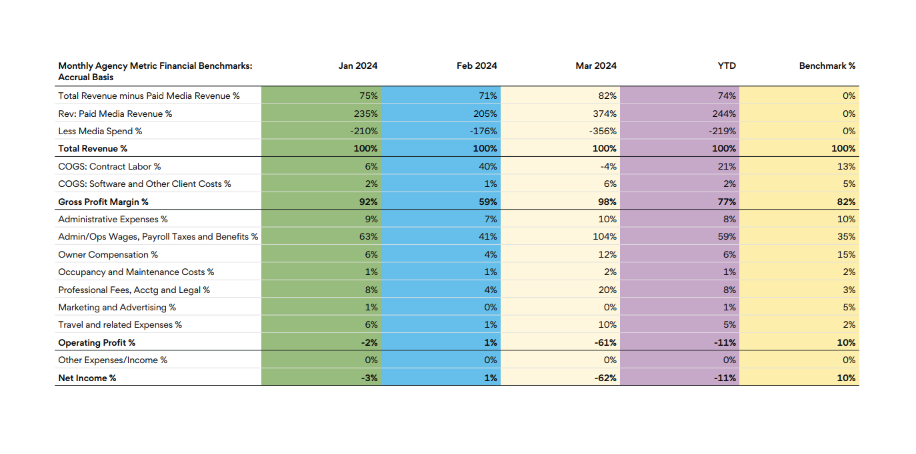
4. Add the trending context
Include a second table showing the same metrics as percentages, with your benchmark column alongside. This creates the side-by-side comparison that fuels coaching conversations: "Your wages are at 59% of revenue this quarter—the benchmark for a healthy agency is 35%. Let's talk about what's driving that."
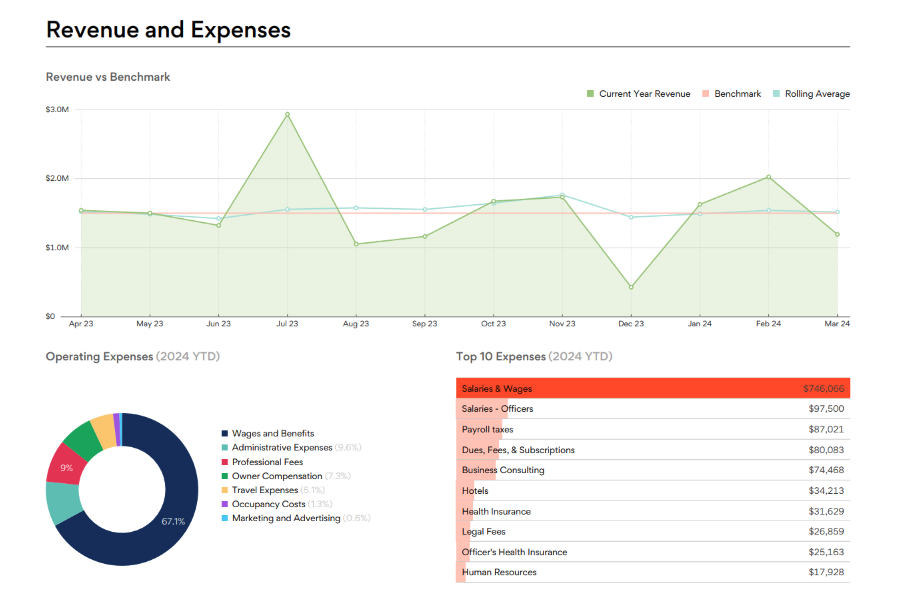
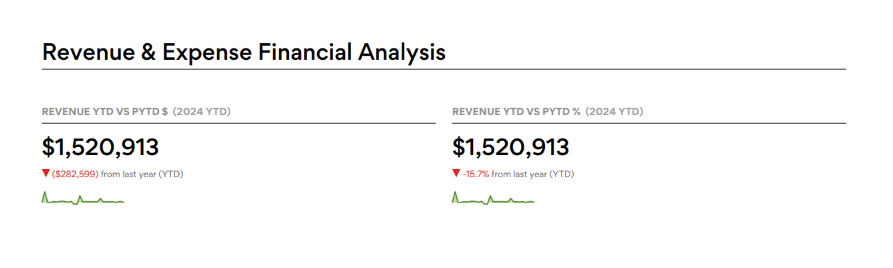
5. Layer in visual analysis
For example: add charts for Revenue vs Benchmark (with rolling averages), Operating Expenses breakdowns (pie charts), and Cash Position tracking. Include KPI cards showing Revenue YTD vs Prior Year with variance indicators (up/down arrows with percentages).
6. Save and scale as a proprietary template
Once complete, save the report as your firm's template. Apply it across all clients in the same industry for consistency, and use Fathom's scheduling to automate monthly delivery. Position it to clients as your proprietary framework—something they can only get from your firm.
Customer spotlight
Jason Blumer, CPA, CEO of Blumer CPAs and Thriveal
Jason Blumer has spent 25 years leading Blumer CPAs, a firm known for its advisory-first approach to serving creative and digital agencies. He's also the CEO of Thriveal, where he's spent 15 years teaching accounting firms how to grow, scale, and deliver meaningful advisory services.
Jason's philosophy centers on the idea that advisors should have opinions. His firm doesn't just present financials; they interpret them, benchmark them, and coach clients through the implications. This approach has made Blumer CPAs a trusted partner for clients looking for more than just compliance work.
Here more from Jason by watching his full Ask an Expert session here.