
December 15, 2025

To interpret a financial health check, you need to understand the metrics, analysis methods, benchmarks, targets and improvement strategies that might apply. These may vary depending on your data, your objectives, and the insights you are seeking.
A financial health check is a performance report that combines financial and non-financial data to deliver essential business insight.
You can create a comprehensive financial health check by importing diverse financial and non-financial business data into reporting software like Fathom. You could also use spreadsheets that have been custom built.
Read André’s previous expert article: How to create a financial health check ->
To interpret your financial health check, you need to do 3 main things:
“To get value out of your financial health check, you need to be able to look at the pieces of the puzzle and understand the picture. And then, you need to know what to do next. I have a structured list of strategies that I discuss with my clients. In this blog, I have simplified some of the main components so they can support your decision making.”
Leading and lagging data can be used to demonstrate cause and effect, which is 1 of the 4 core principles of the financial health check.
A meaningful understanding of cause and effect is essential to help you predict business outcomes and determine the best actions and strategies for your business.
Financial measures are outcome-based and generally lagging. They send messages about what has taken place in the past as a business has sought to implement its strategic objectives.
Lead indicators, on the other hand, are generally driver-based and include any relevant non-financial data. They are either forward-looking elements derived from fully implemented strategic objectives or disruptive elements that prevent the execution of your strategic objective.
In a business, management should be focusing on the leading, non-financial indicators, as opposed to the lagging financial indicators. These are the data points that will show where there are opportunities to change outcomes.
Trend analysis can offer important insights in this context. For example, lag indicators may be on target in any given period. However, if lead indicators are showing a downward trend, managers may be able to anticipate a problem and solve it before it impacts financial performance.
Similarly, correlation analysis can help you to understand the weighting of your leading measures in relation to their corresponding lag indicators. This should make it easier for managers to prioritise interventions.
“In my experience, executives and boards all-too-often celebrate achieving budgeted financial indicators, without realising that the drivers of their results are deteriorating. This is a direct cause of taking action too late to prevent severe financial stress and considerable harm to value creation. I always advise management teams to use non-financial lead indicators to avoid unplanned outcomes.”
There are 5 main analysis techniques that will help you interpret the data in your financial health check.
Fathom has options to conduct and visualise many of these methods of analysis as part of generating your financial health check report.
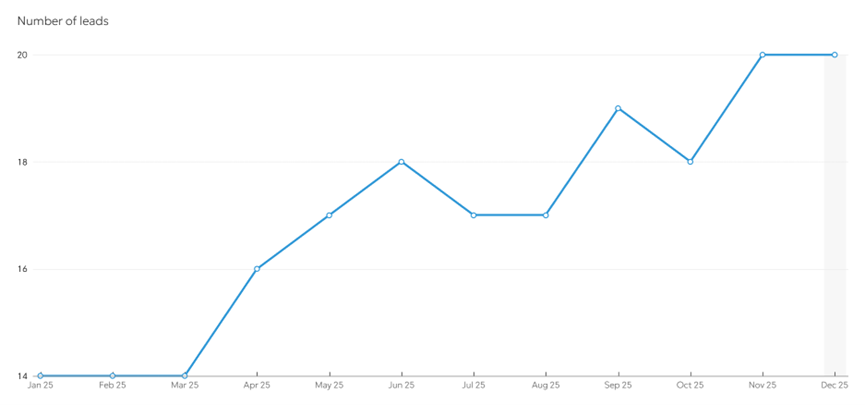
Trend analysis identifies and analyses historical patterns or trends in data over a specific timeline. It can also be useful to project future performance against planned outcomes.
Trend analysis is probably the most common initial technique for assessing the financial performance of a business.
Using the insights from trend analysis could involve adjusting strategies, making investments or implementing change.
“Remember, the trend is our friend … so be sure to understand the messages, because they are reliable and based on truth.”
Learn about Fathom’s trend analysis tool ->
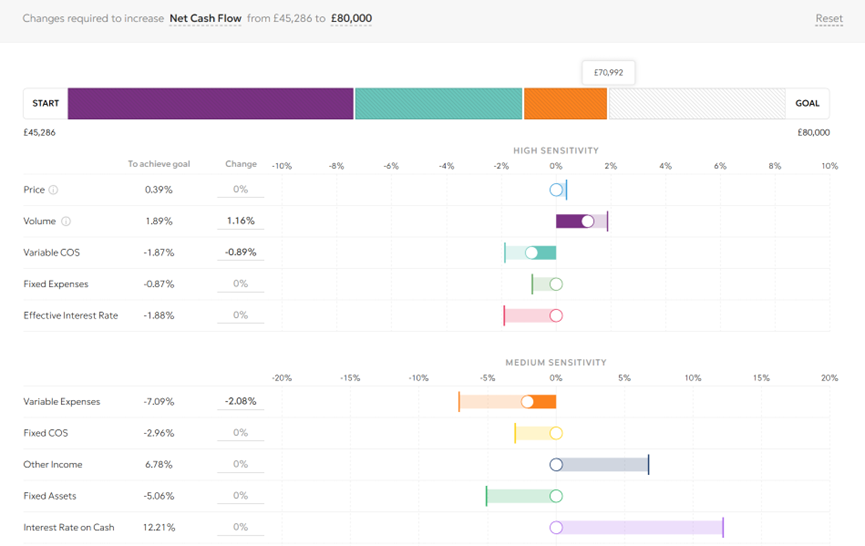
Marginal analysis involves the trending of small (marginal) changes from one period to another, as opposed to the trend of actual reported data.
It is most used to evaluate the impact that these small changes could have in a business. You might analyse multiple scenarios (i.e. several different potential marginal changes) to make an informed decision.
Learn about Fathom’s scenario comparison charts ->
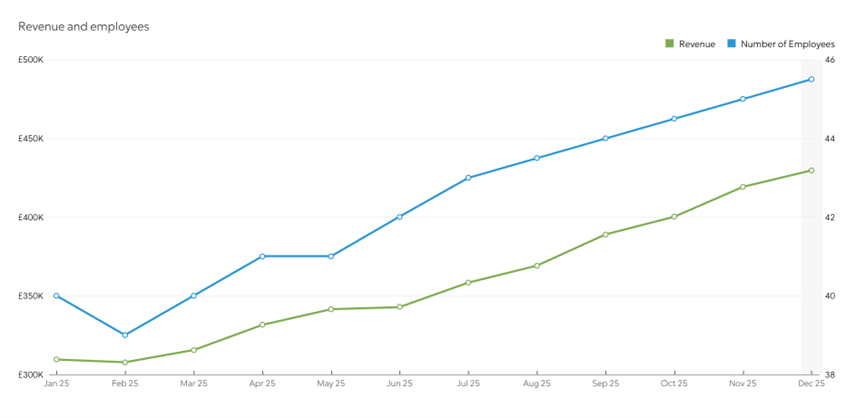
Correlation analysis demonstrates linkages between drivers and outcomes. It will clearly show either a positive or a negative correlation between 2 or more variables.
The primary goal in correlation analysis is to determine whether there is a statistical association between the variables. And, if so, to what extent?
The most common metrics used in correlation analysis is the correlation coefficient, which quantifies the strength and direction of the relationship between 2 variables.
But, take care. Correlation does not imply causation. Just because 2 variables are correlated, it does not necessarily mean that one causes the other. Other factors not accounted for in the analysis may be influencing the relationship.
Event analysis identifies the cause of disruption or enhancement of normalised performance. This is a practical way to interpret trend analysis.
This technique is used to identify the reasons a change has occurred in reported data at a given point in time – and to understand if that event is likely to recur.
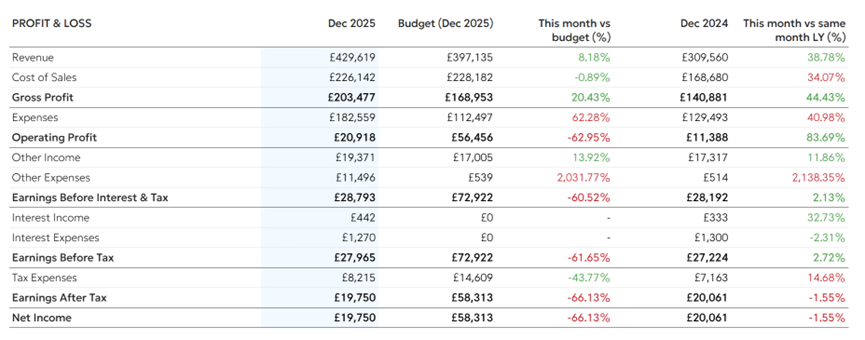
Variation analysis compares differences between 2 or more measures. It is based on a simple comparison of reported data versus budgeted data. The analysis usually includes the percentage variation between the 2 data sets.
The key is to set realistic and acceptable thresholds for variances.
Variation analysis enables companies to identify and manage under- or over-performance in relation to particular metrics or targets. But remember to factor in cause and effect to this basic analysis
Composite analysis combines numerous metrics into a single performance indicator.
The single indicator is calculated based on the estimated weighted impact, or relative performance, of each participating measure.
Composite analysis is powerful because it enables you to align performance with strategic intent.
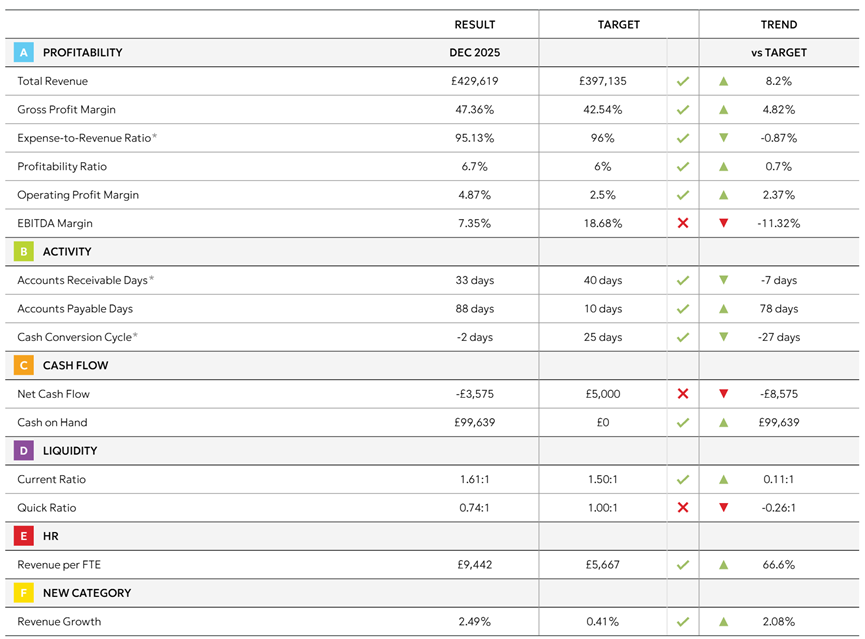
You may group indicators in various ways, including by high-level thematic categories (e.g. Growth, Profitability, Liquidity and so on), or by importance to your business or expected impact on planned strategic outcomes (e.g. Critical, High, Medium and Low).
Composite analysis is a new dynamic way to present financial performance data to all levels of management and teams who may not be financially literate.
“Fathom software supports composite analysis brilliantly, allowing you to easily sort and visualise your metrics, and apply your custom weightings to each category.”
Both benchmarking and target setting enable a business to integrate its financial health check findings into the ongoing development of its goals and strategies.
There are several different types of benchmarking including:
Take care when conducting any external benchmarking that normalisation has been correctly adjusted in the database.
Learn how to create an internal benchmarking group in Fathom ->
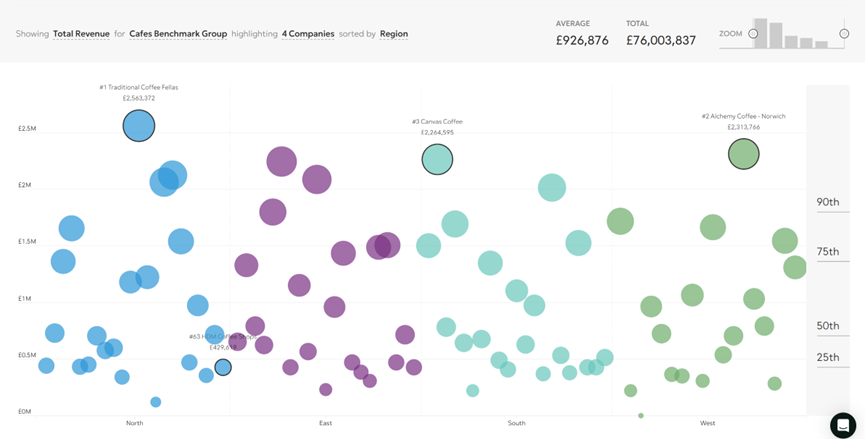
The primary purposes for benchmarking are usually for companies to:
Learn about Fathom’s compare tool and rank tool ->
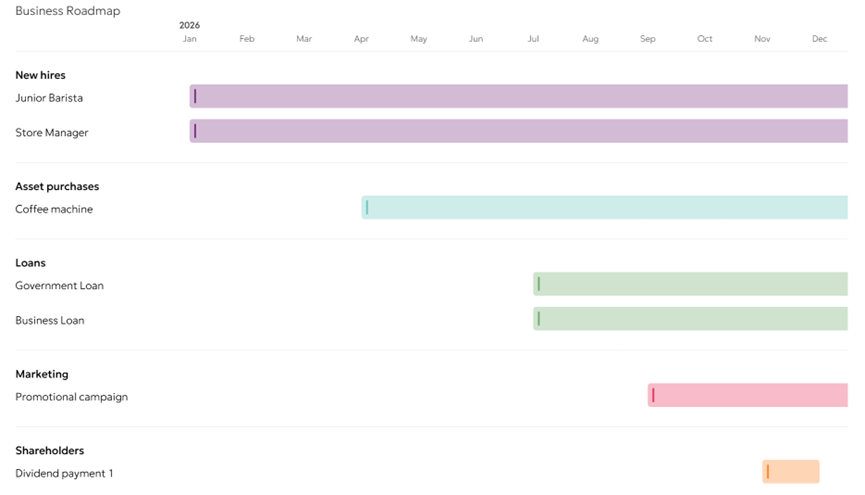
Performance targets are normally used to measure the success of how the objectives in the strategic plan have been achieved. They should be informed by both your benchmarking activity and the findings from your financial health check report.
Performance targets can also guide companies to uplift practices and set a trajectory towards a desired final state.
In addition, such targets are commonly linked to:
Learn how to set targets in Fathom ->
If you are a business owner or executive creating your own financial health check, you may want to talk to your accountant or professional advisor for targeted guidance and strategies to suit your circumstances.
To get you started, however, below is a quick explanation of some of the most common and useful metrics. I have also included a list of simplified strategies that can help improve under-performance in these areas.
Use Fathom’s Goalseek Analysis tool to model scenarios and identify the key drivers behind your targets.
Master the metrics with Fathom’s KPI Glossary for clear definitions, practical examples, and insights to help you interpret every measure with confidence.
Discover how Fathom can help you create your financial health check and confidently own your future.
Start a free trial. No credit card required. Connect your accounting platform in minutes and start delivering the insights that strengthen every client relationship.

André Van Zyl FCA is a recognized authority in enterprise value creation. A Fellow of Chartered Accountants Australia and New Zealand, André brings decades of experience shaping business strategy and financial performance. He is the founding director of a leading business consultancy, a former partner and principal at top-tier accounting firms, and serves on advisory boards for companies across Australia. His insights draw on a rare blend of technical expertise and practical leadership. André is also the author of Business Beyond Survival (2024), a definitive guide to building resilient, growth-focused businesses.
Connects to your favourite accounting tools. No set up fee. No credit card required.
Try free for 14 days →Trusted by 100,000+ businesses worldwide
Get a clearer picture of your business performance and in-depth analysis of your numbers.
See all features
Live data from your favourite accounting tools in Fathom. No exports, no manual uploads, ever.
See all integrations
Trusted by 100,000+ businesses worldwide
Fathom connects your accounting tool automatically and handles the heavy lifting — so you can focus on what the numbers actually mean.
Try free for 14 days →No setup fee

No credit card
AI Commentary

